Mobile Version Under Construction
Please view on Desktop for the best experience
Contact: +65 6245 4965
Email: support@asiaimaging.com
Please view on Desktop for the best experience
Contact: +65 6245 4965
Email: support@asiaimaging.com
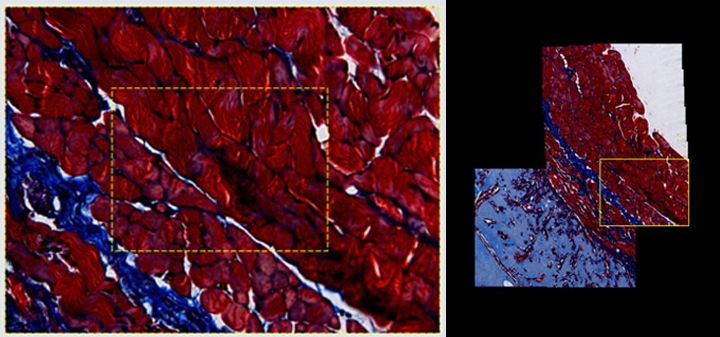
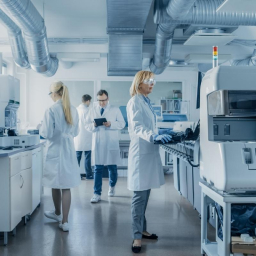
From supercharged multi-channel capture to protocol-driven analysis, Image-Pro is designed to optimize every workstation in your imaging lab.
Get in Touch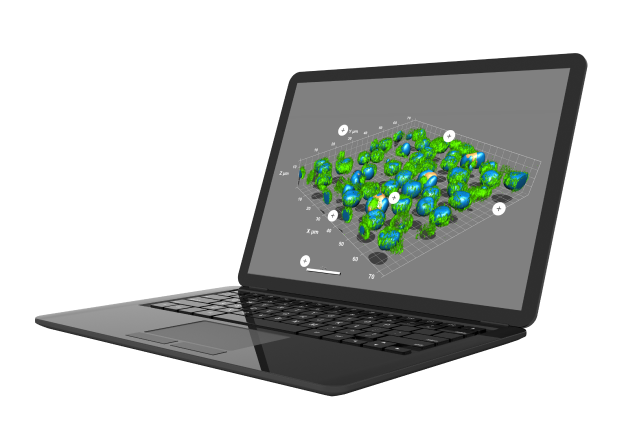

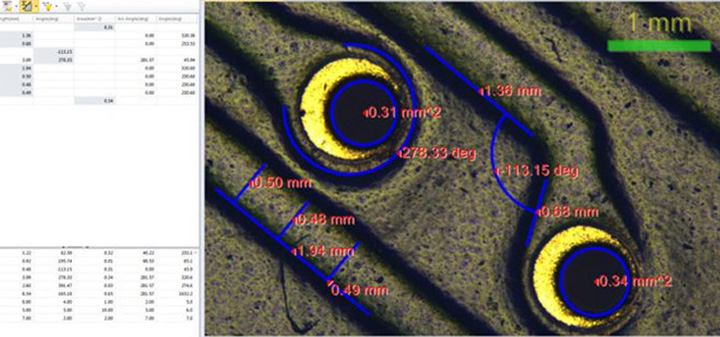
 2D Measurements
Draw Easily, Measure Accurately
Drawing point-to-point lines, pitch lines, polygons, rectangles, circles, polylines, and angles is fast and easy with tools that are sensitive to your movements, while being intuitive and helpful.
Add Points to Build Measurements
A straightforward way to create the most accurate “Best Fit” circles, arcs or
lines to any object. Simply add a few points along the edge of the object
and
Image-Pro builds the measurements.
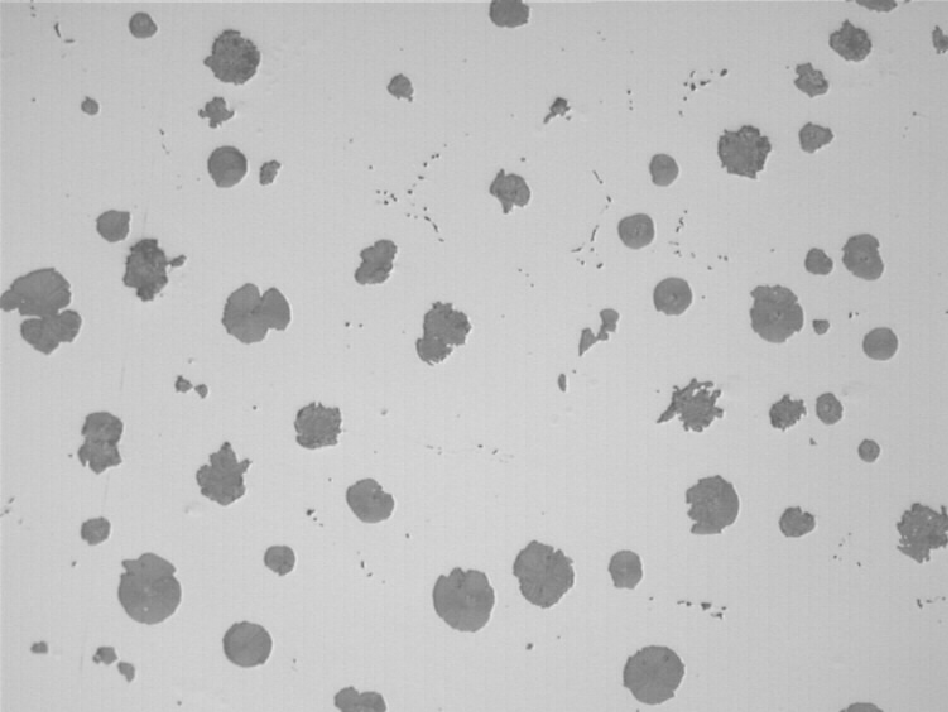
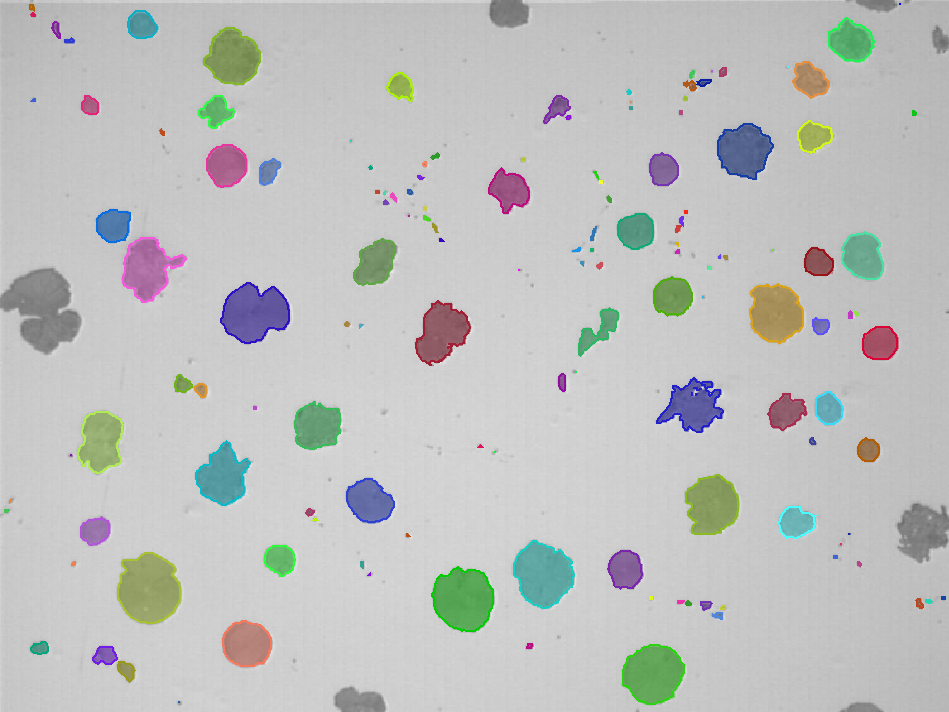
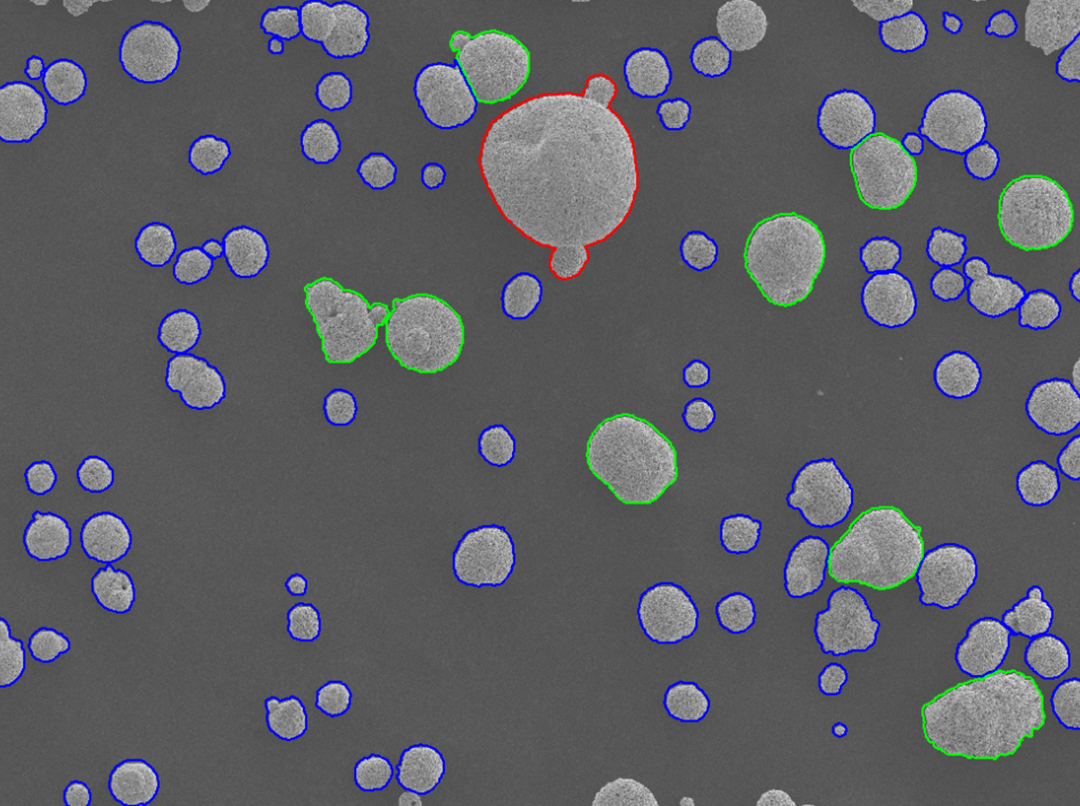
Click to Count and Classify
A straightforward way to quickly identify a number of objects in your image. Use the data table to keep track of the statistical total or set up classes and count objects per class as well.
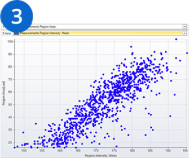
Relative Measurements
Measure relationships between existing Direct Measurements. Select two or more and measure the distance between object centers/min/max, incremental line distances, angles between lines and more.
Auto Snap to Edge
For snapping to (straight edge, any edge, line length, line edges, along edge, circle).
Draw accurate line measurements every time with the Snap Measurement tools. Simply draw and the measurement will accurately snap along object edges.
Extract accurate data from your calibrated images with a wide range of direct drawing and assisted drawing measurement tools.
Extract accurate data from your calibrated images with a wide range of direct drawing and assisted drawing measurement tools.
Extract accurate data from your calibrated images with a wide range of direct drawing and assisted drawing measurement tools.
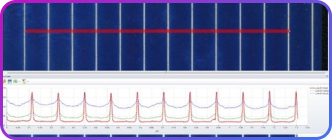
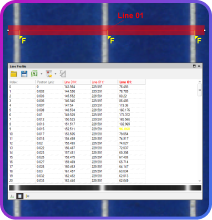
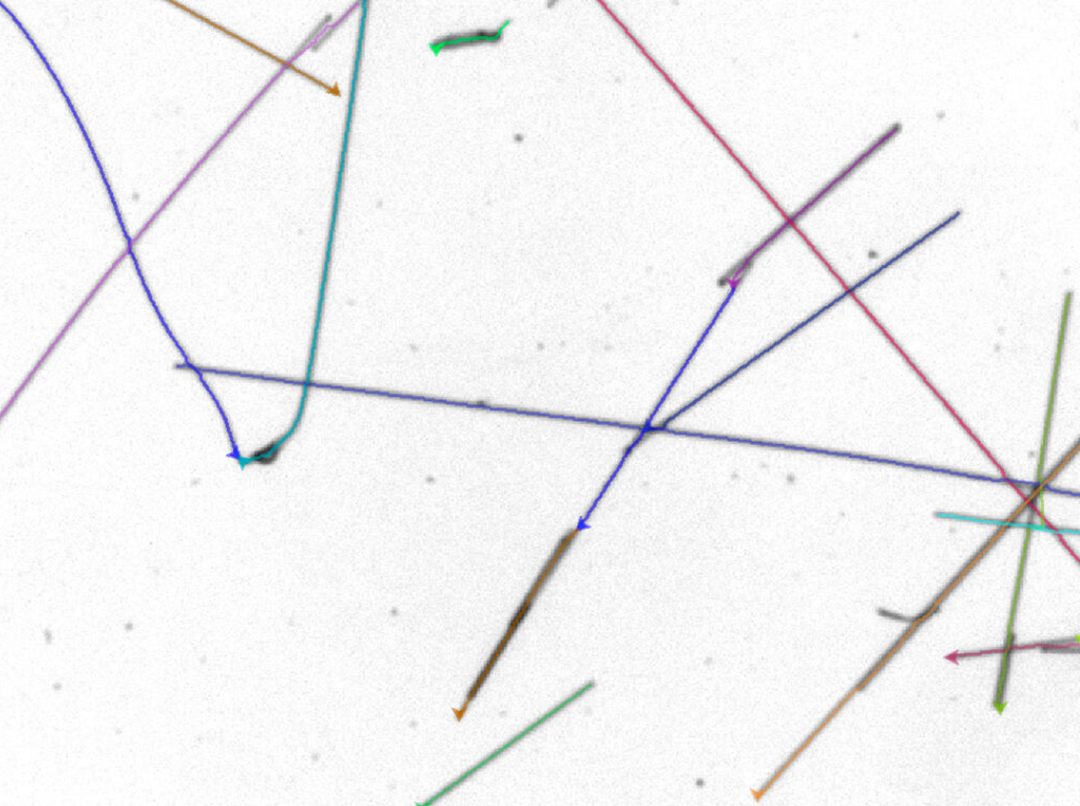
Draw a variety of lines and shapes for displaying the intensity under the lines as Line Profiles. Manually or automatically find peaks and valleys of intensity along the line for easy ring or edge detection.
Draw Any Shape for Intensity Line Profile
Draw or AutoTrace as many lines or polygons as needed to measure the intensity under the line. Set a shape as "background" to offset other intensity measurements.
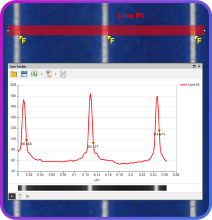
Use Caliper to Find "Edges" Under the Line
See Your Data in an Intuitive Display
Display measurements as a graph, measurements table, or statistics table. Export the graph and data to Excel or to a custom report.
Use different colors, shapes, and custom names to classify and
organize
your measurement
data.
Using classes lets you group objects together, report on class totals, see
powerful class statistics.
Manual Classification
Manually assign unique class colors to objects and their overlays for easy visual separation and measurements grouping.
Auto Classification
Use Single Variable Classification to easily auto-classify objects evenly into bins based upon a single selected measurement.
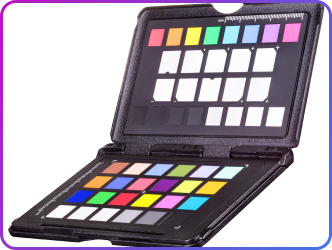
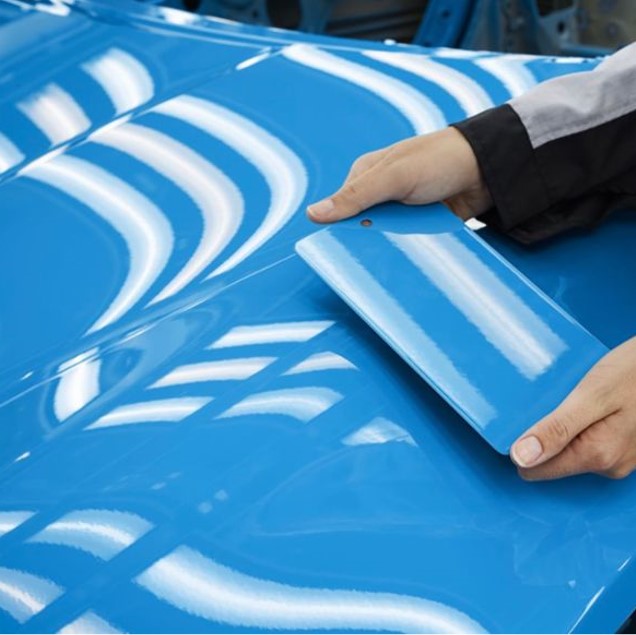
Perform absolute color measurements or color differences in CIE L*a*b*® or XYZ color coordinates. It’s also just as easy to color correct from a reference image.
CIE L*a*b*® Color Measurements
View per pixel or extracted as mono images. Define color as sRGB or a Color Profile.
Digital Colour Correction
Adjust one image by a reference using an existing image or a color transform from points. Also, display your Color Transform in 3D Viewer.
Common Uses
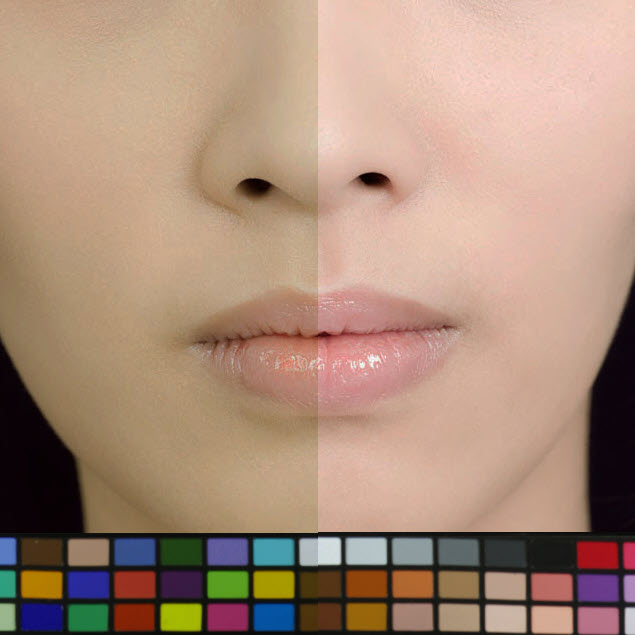
Cosmetics
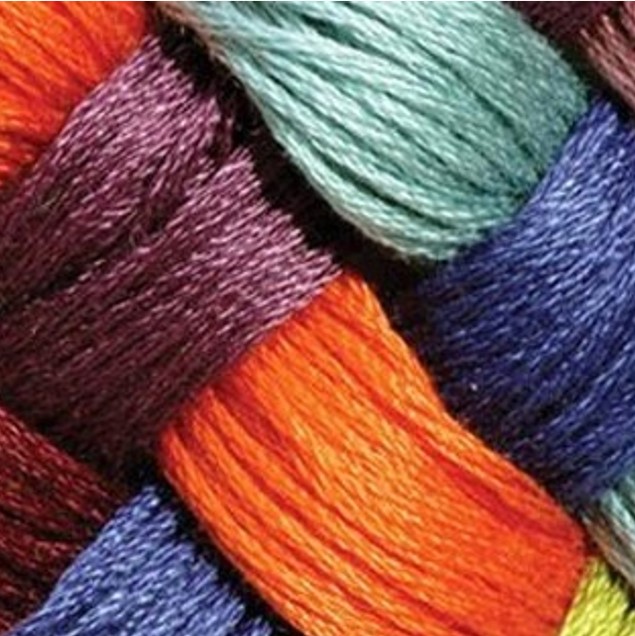
Textile Manufacturing
Automotive

Pharmaceutical
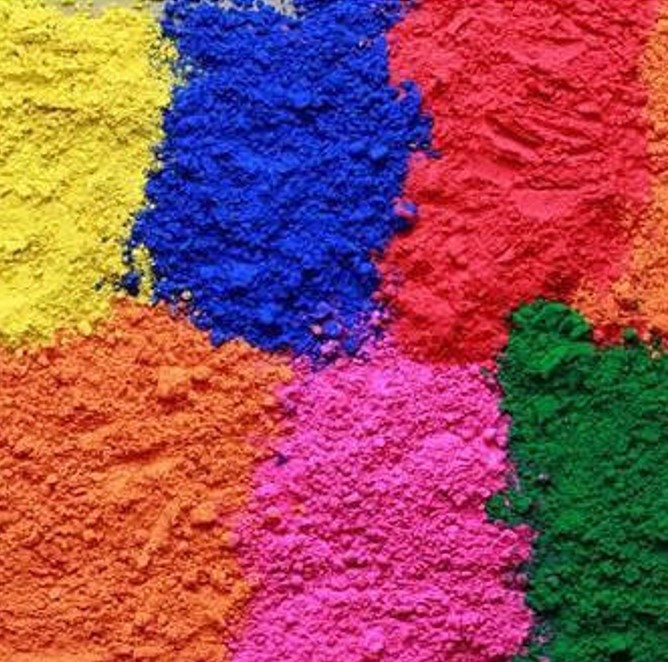
Food Industries
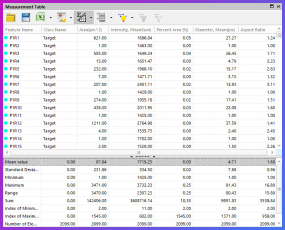
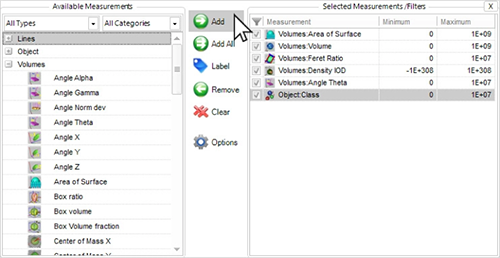
Choose from 144+ measurements for single or multiple images, store them in data
tables,
and visualize the results in a variety of graphical formats.
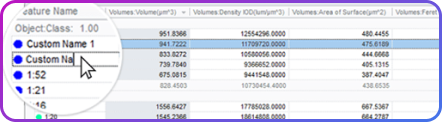
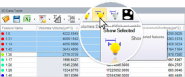
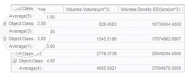
Rename objects by clicking and typing in the table. Also, arrange all objects by color-coded class to see relationships.
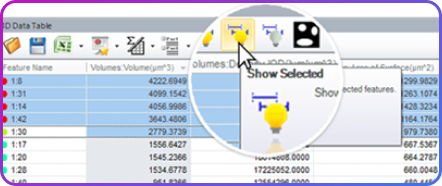
Sort by measurements and adjust tables to only show the relevant data.
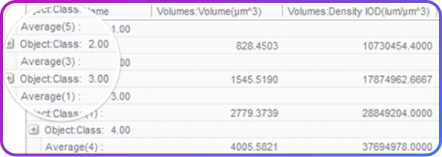
Combine classes of similar objects into a custom hierarchy and see statistics per measurement for each grouped class.
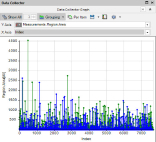
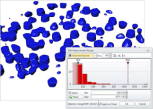
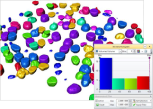
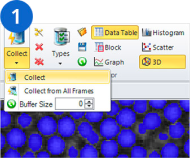
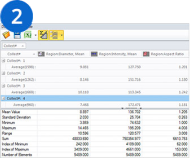
Data Collector
Use Data Collector to gather data from multiple experiments, organize results into one location, and display analytics just as you need it.
 Automatic CollectionData/Image LinkageData GraphingData ExportReportingData Statistics
 2D Automated Analysis
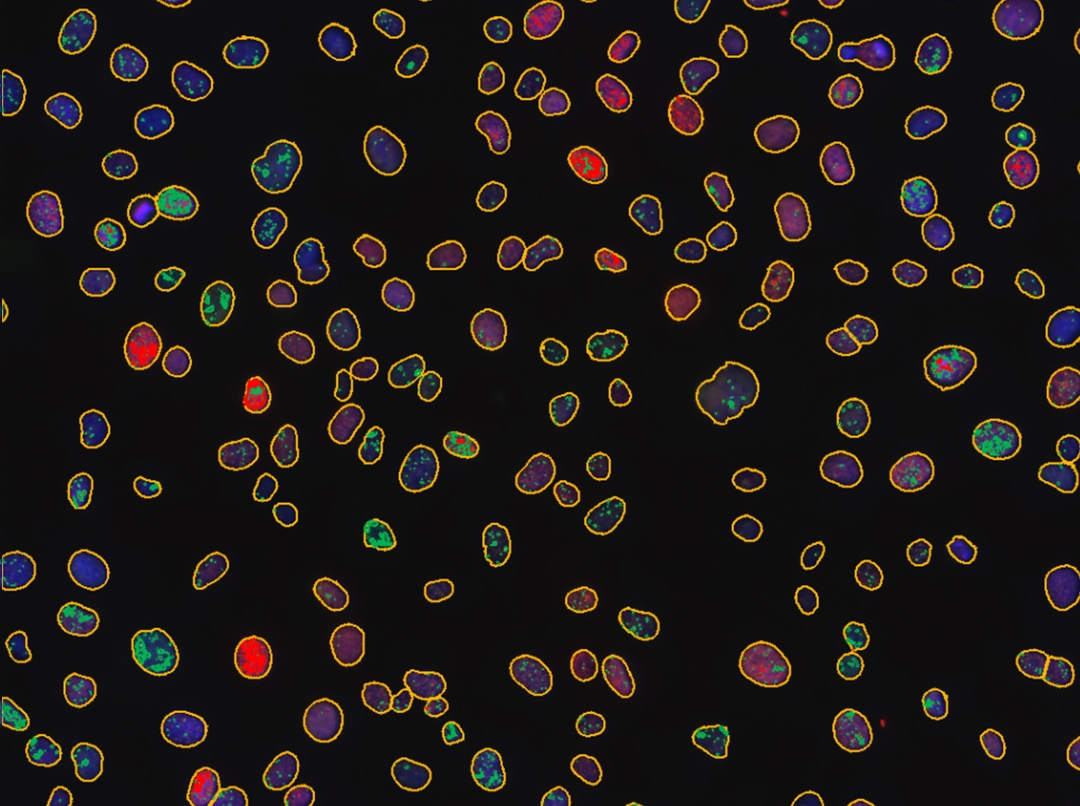
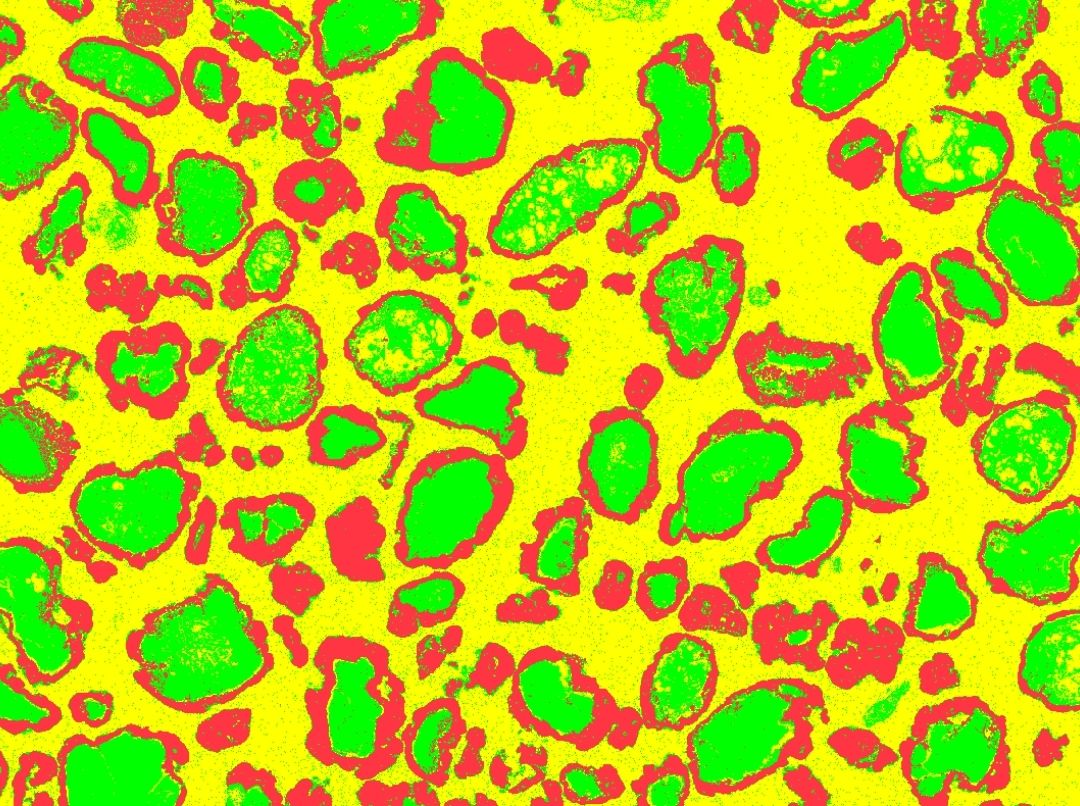
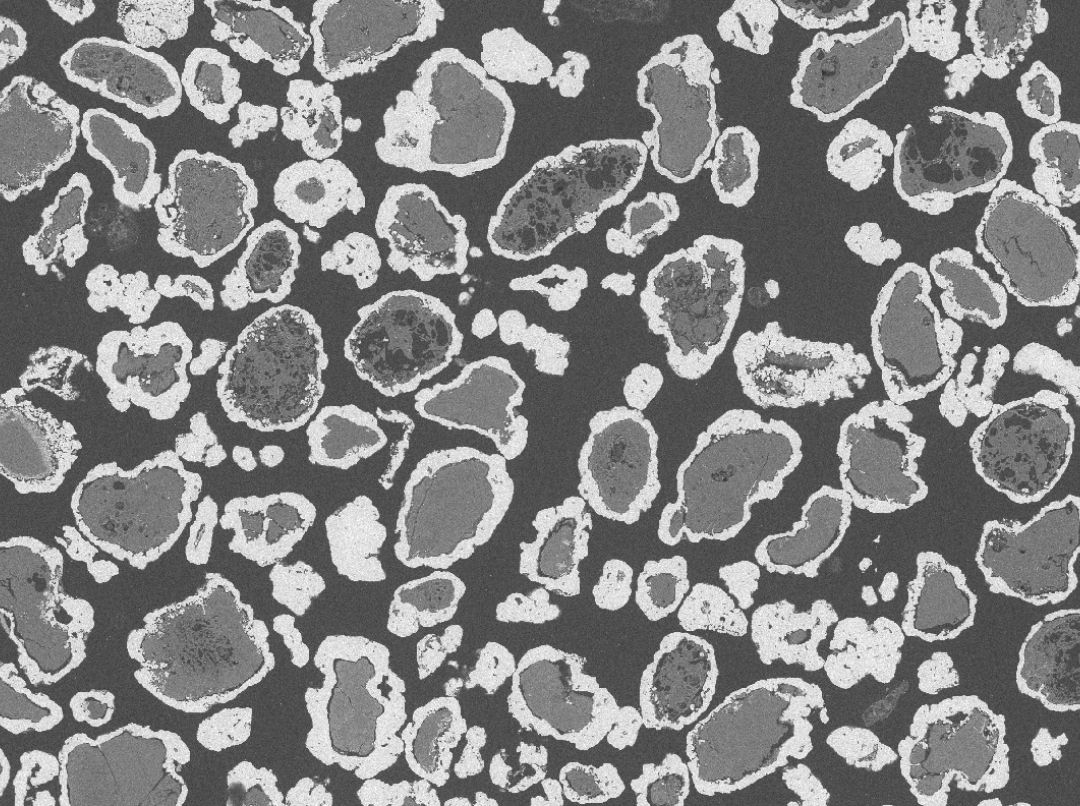
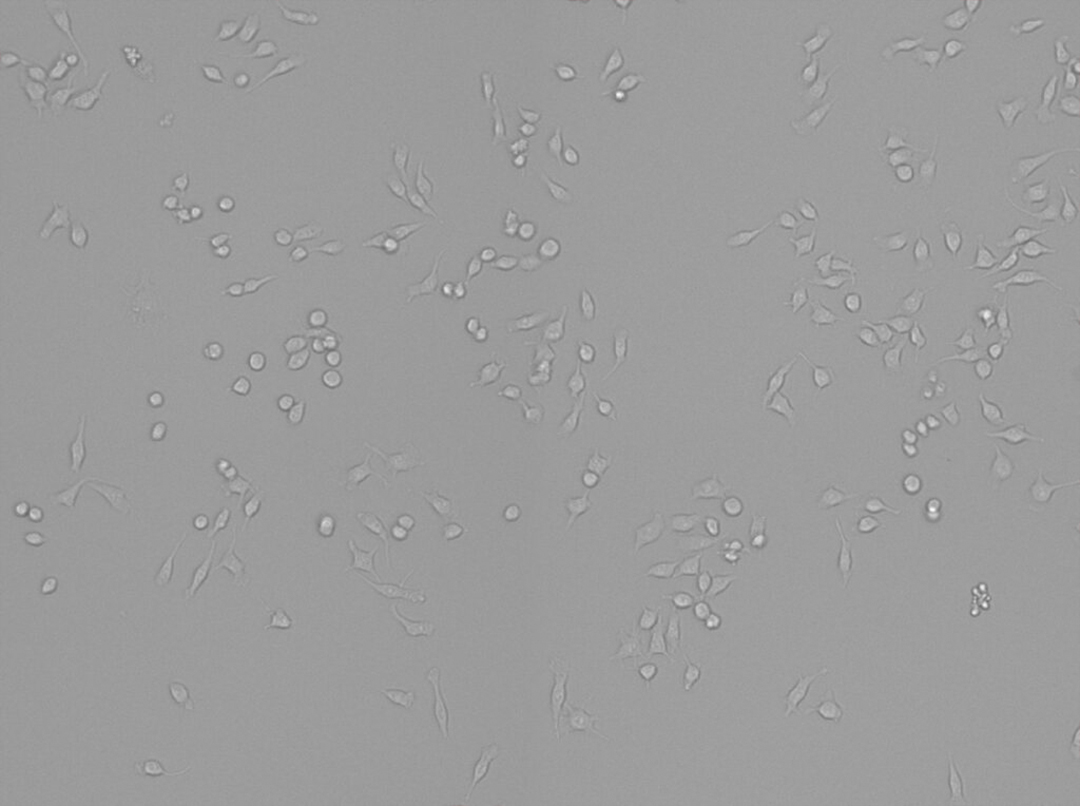
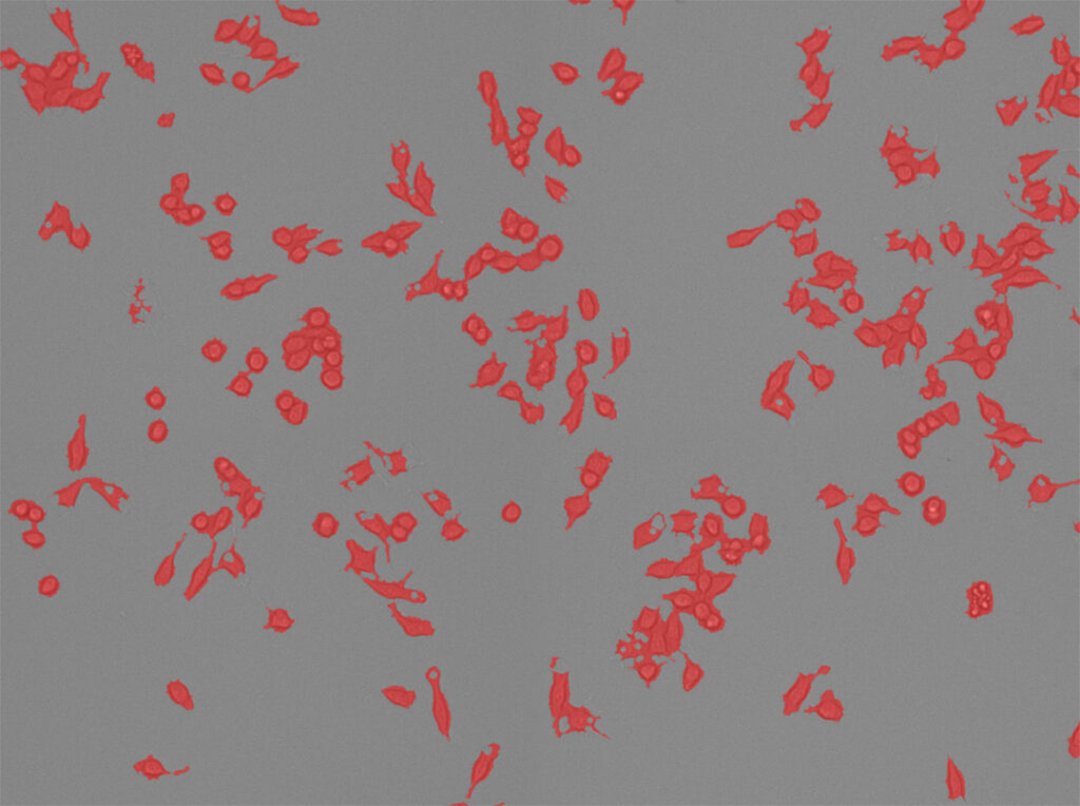
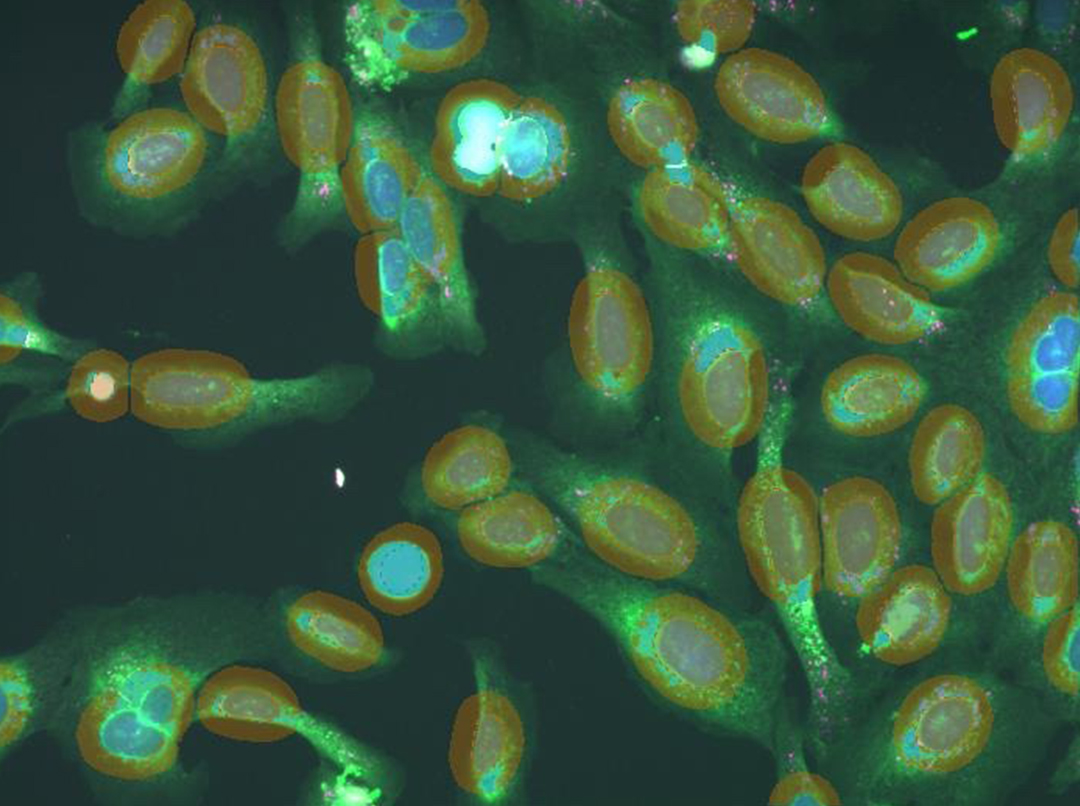
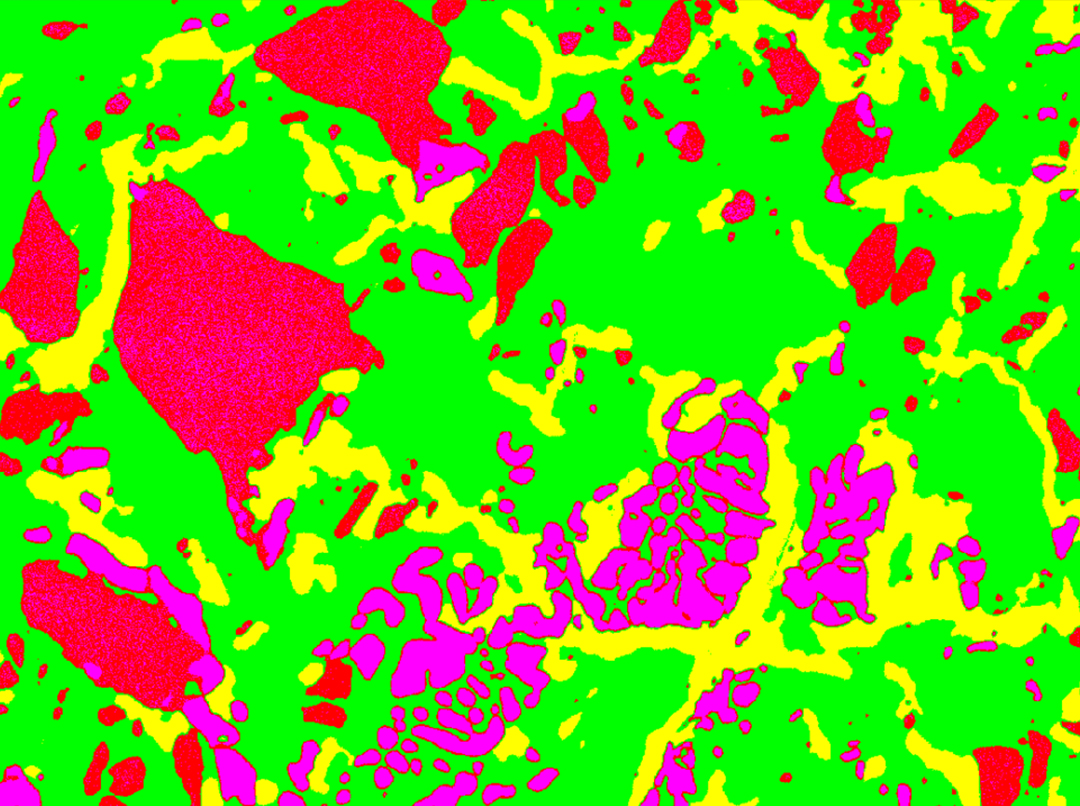
Use Smart Segmentation Machine Learning to find and extract relevant regions per channel, properly classify, and accurately measure using an intelligent pixel classification recipe.
Adjust settings and then save new versions of any Protocol to create your own customized Protocol. Custom name your channels, segmentations, and results.
Multi-threaded processing runs analysis or multiple images in parallel across all available CPU Cores.
Analyze relationships between and across multiple channels, wells/sites, and regions seeding the results of one channel with those of another.
Batch Process a folder full of single images or a single image set with many wells/sites contained within — delivering consistent and repeatable results every time.
Quick access to powerful relationship data in Data Collector tables, Graphs, Charts, and Custom reports auto-generated for each Protocol.
Essentials Collection
Image-Pro's library of Protocols is rapidly expanding and making
image analysis easier than ever.
Each Protocol is packed with powerful analysis tools
designed
to deliver flexible and intuitive options.
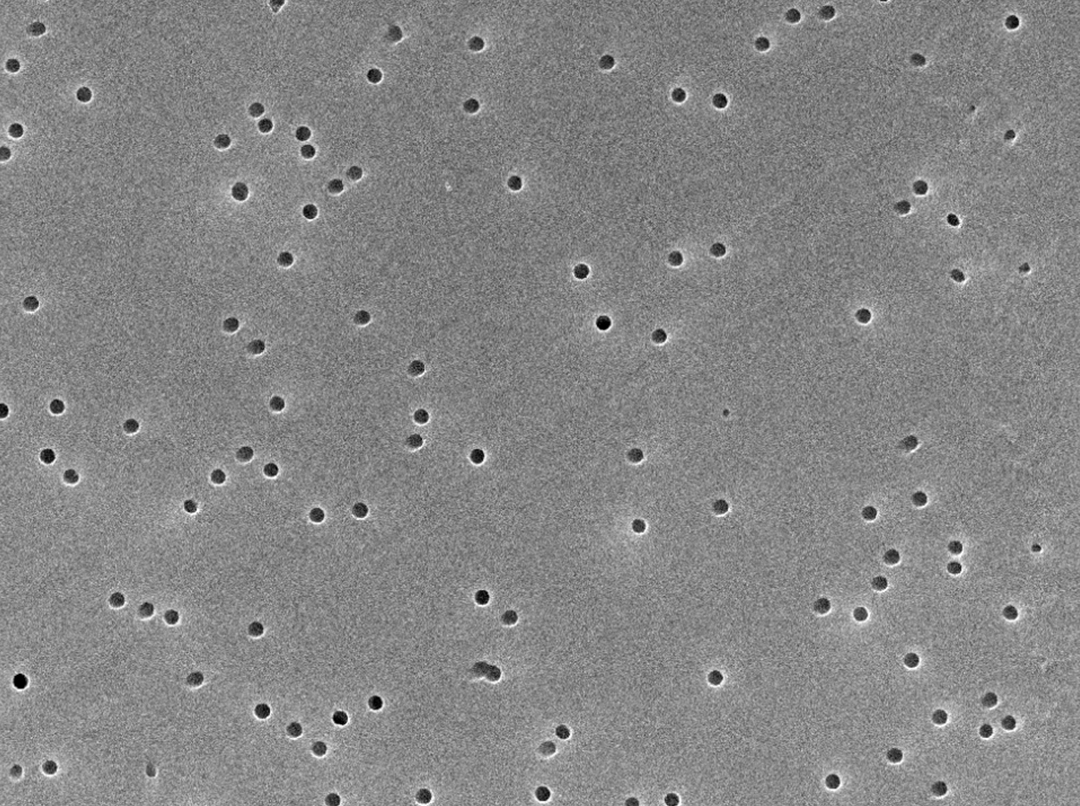
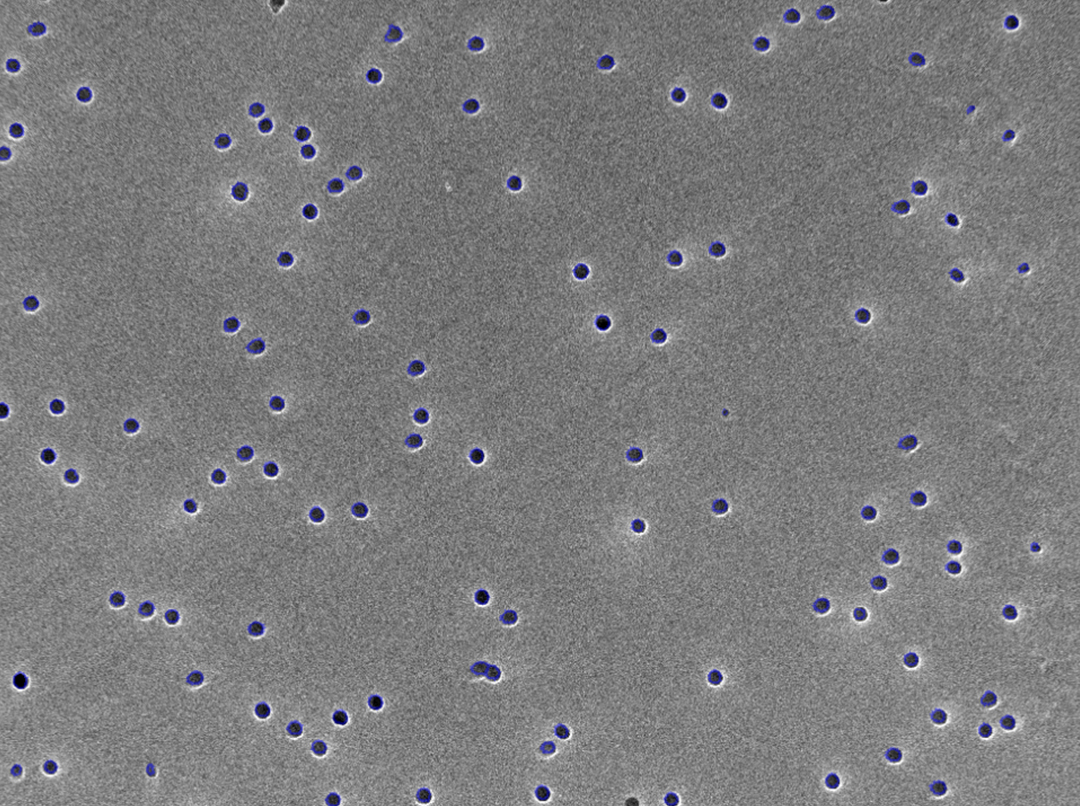
Counts and classifies objects in the region of interest.
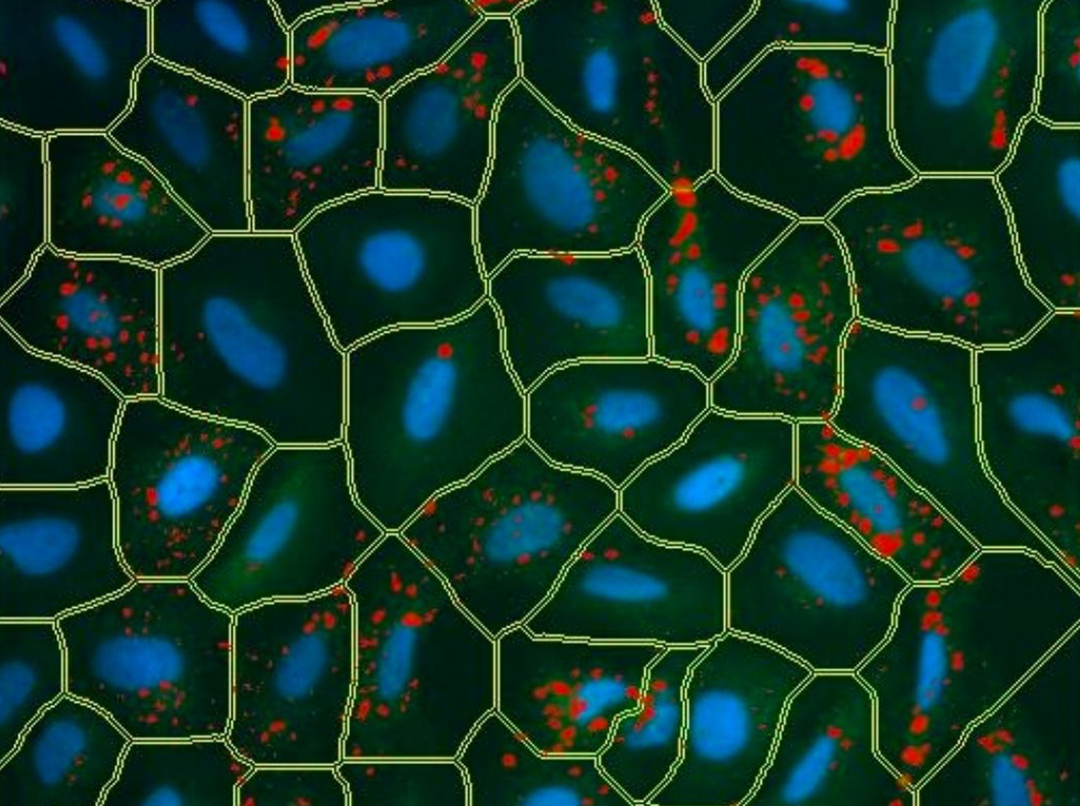
Measures objects (children) within objects (parents).
Measure percentage area covered by segmented objects.
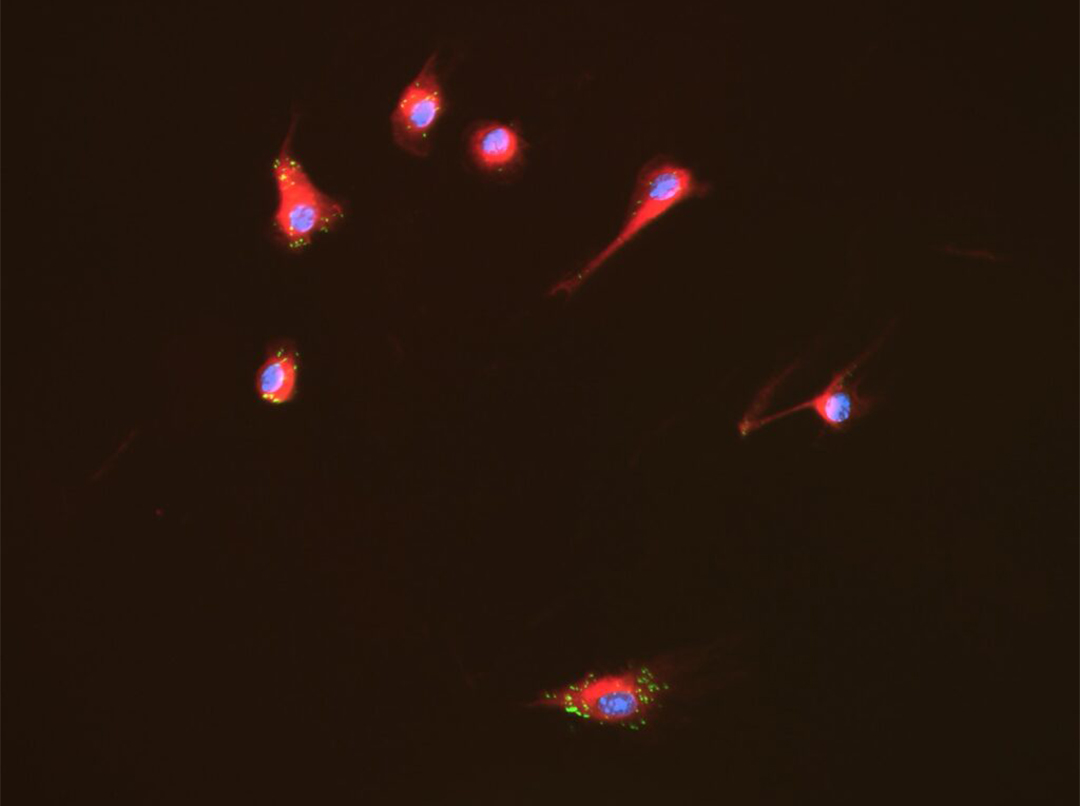
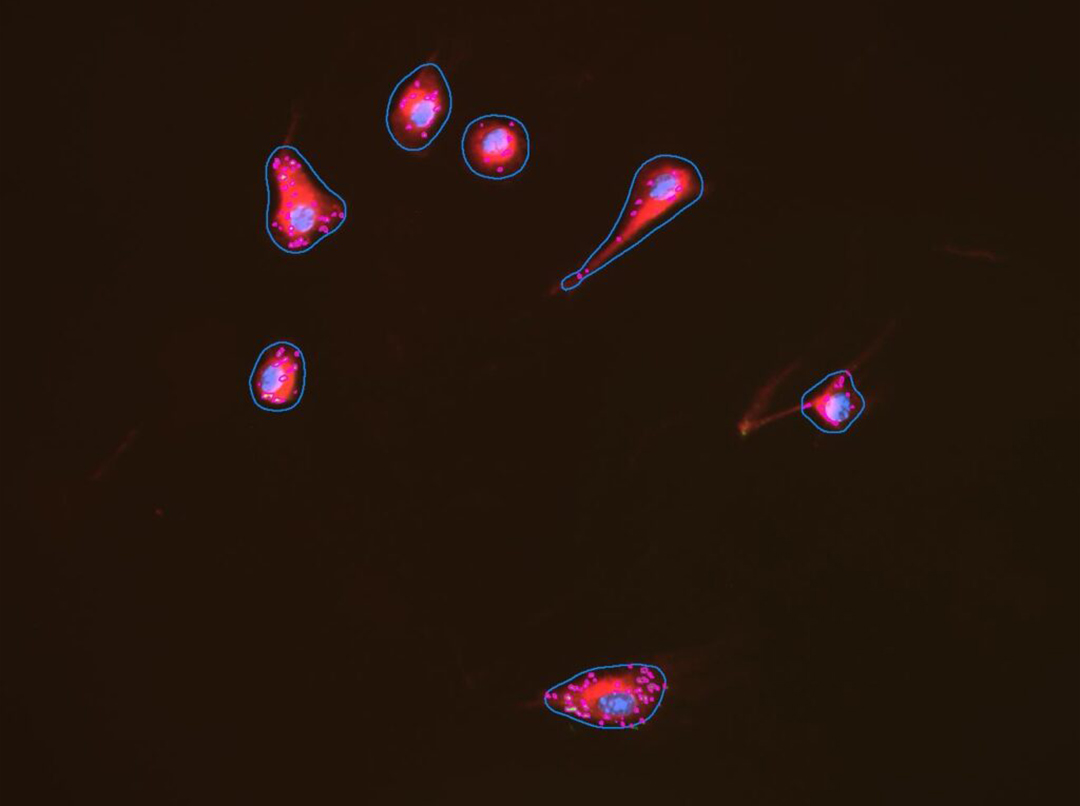
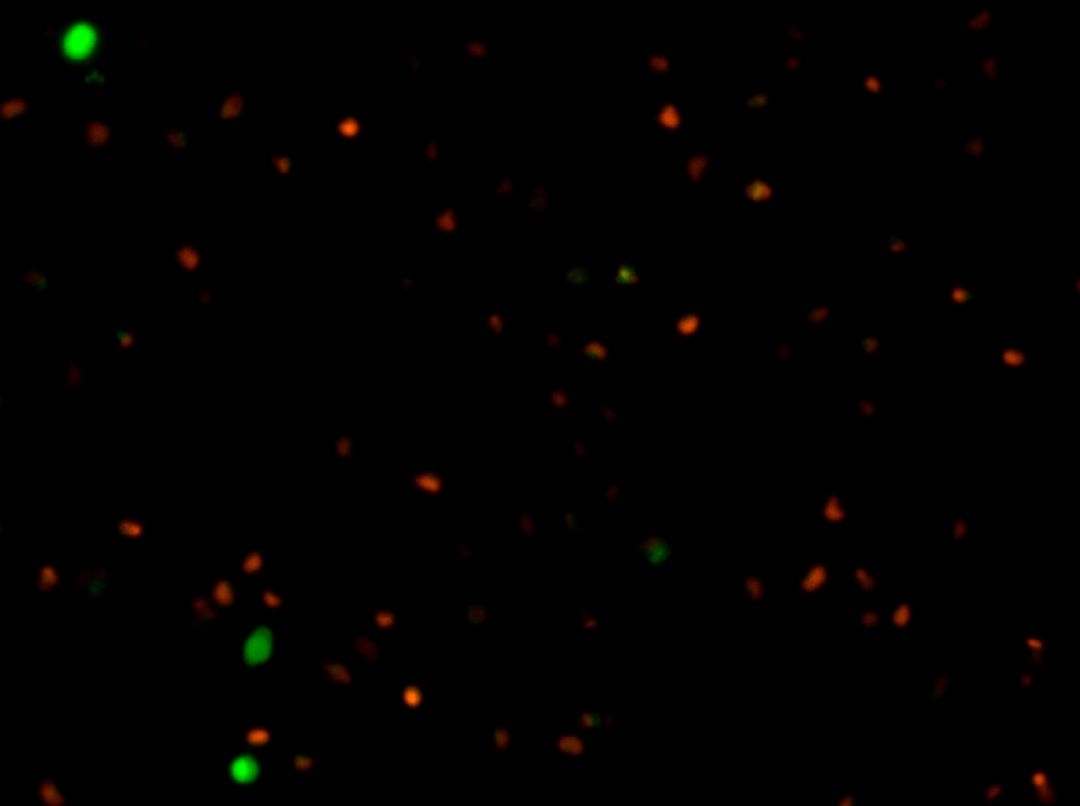
Measures apoptosis based on caspase activation of fluorescently labeled cells.
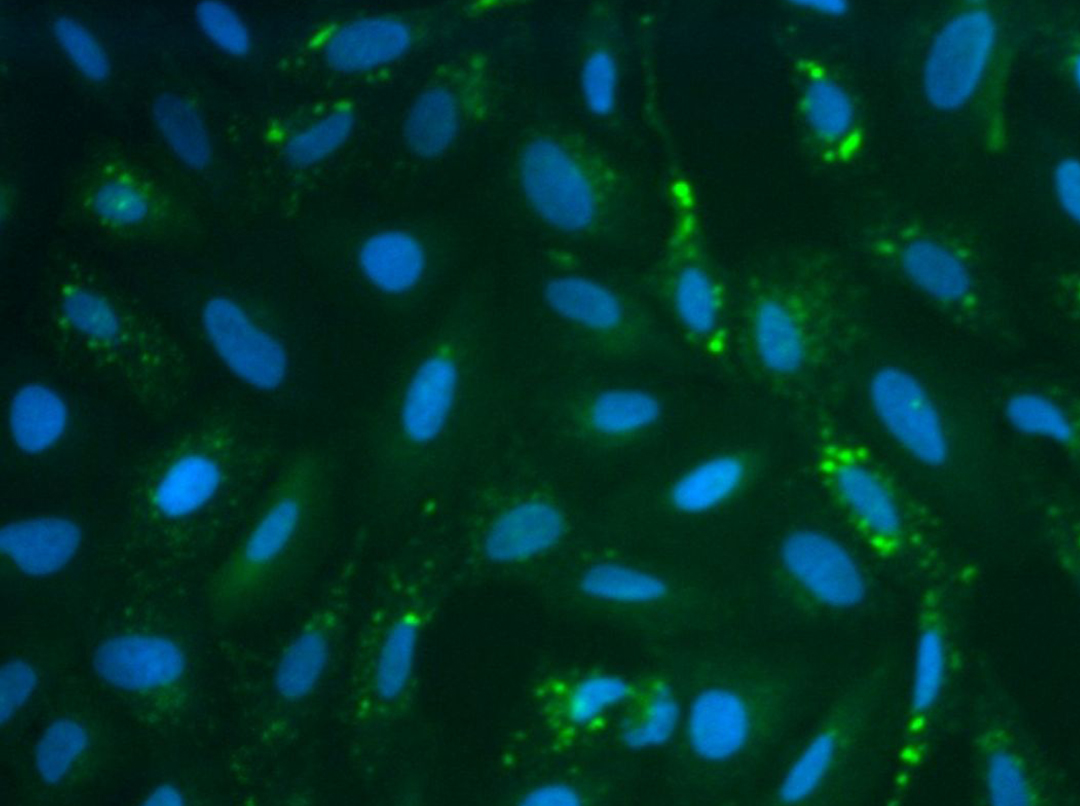
Measure the number of fluorescently labeled autophagosomes in cells containing fluorescently labeled nuclei.
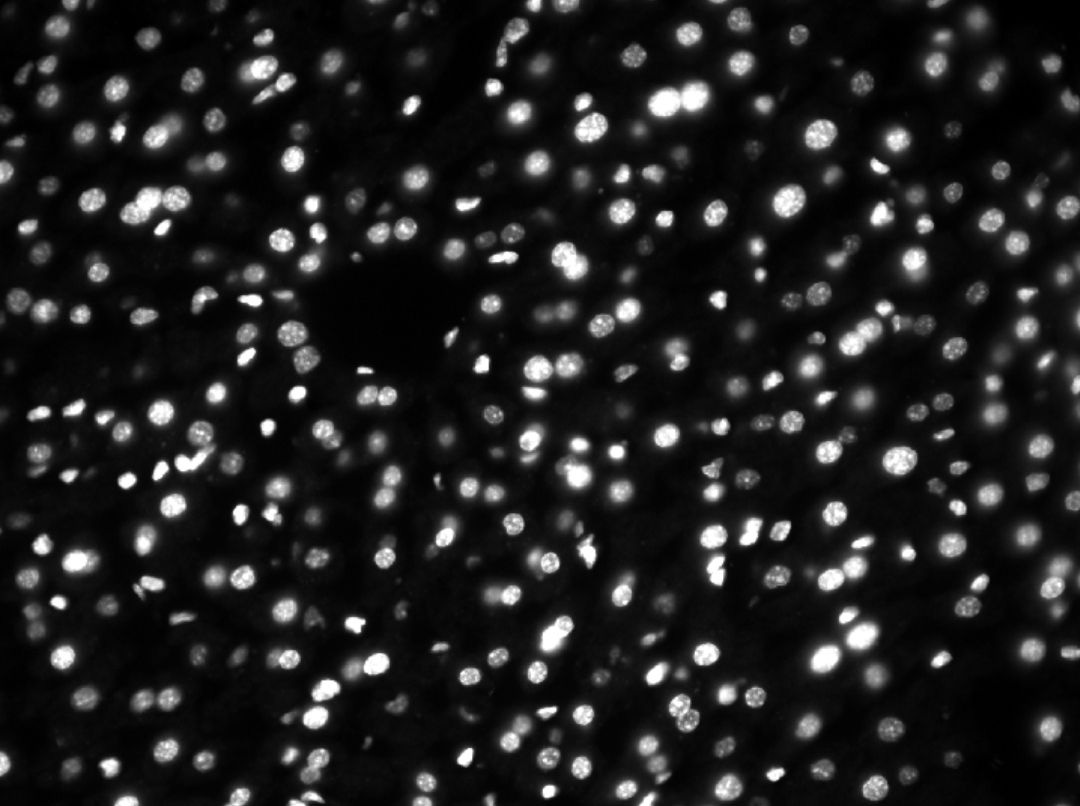
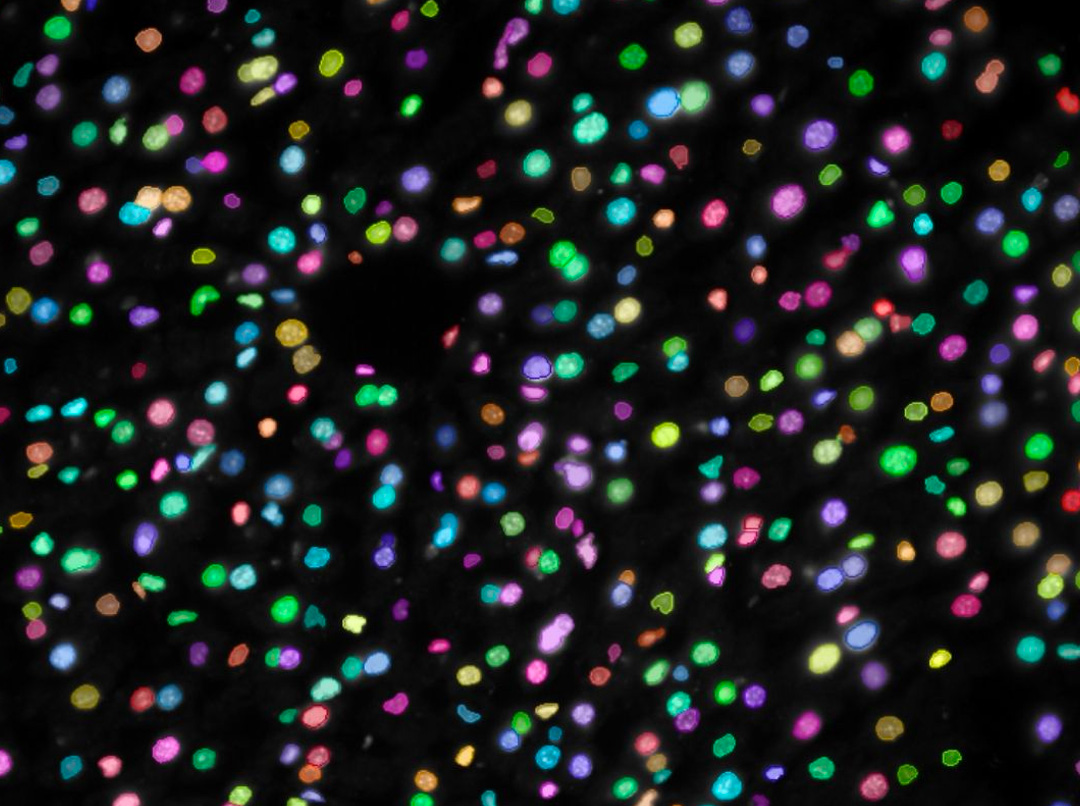
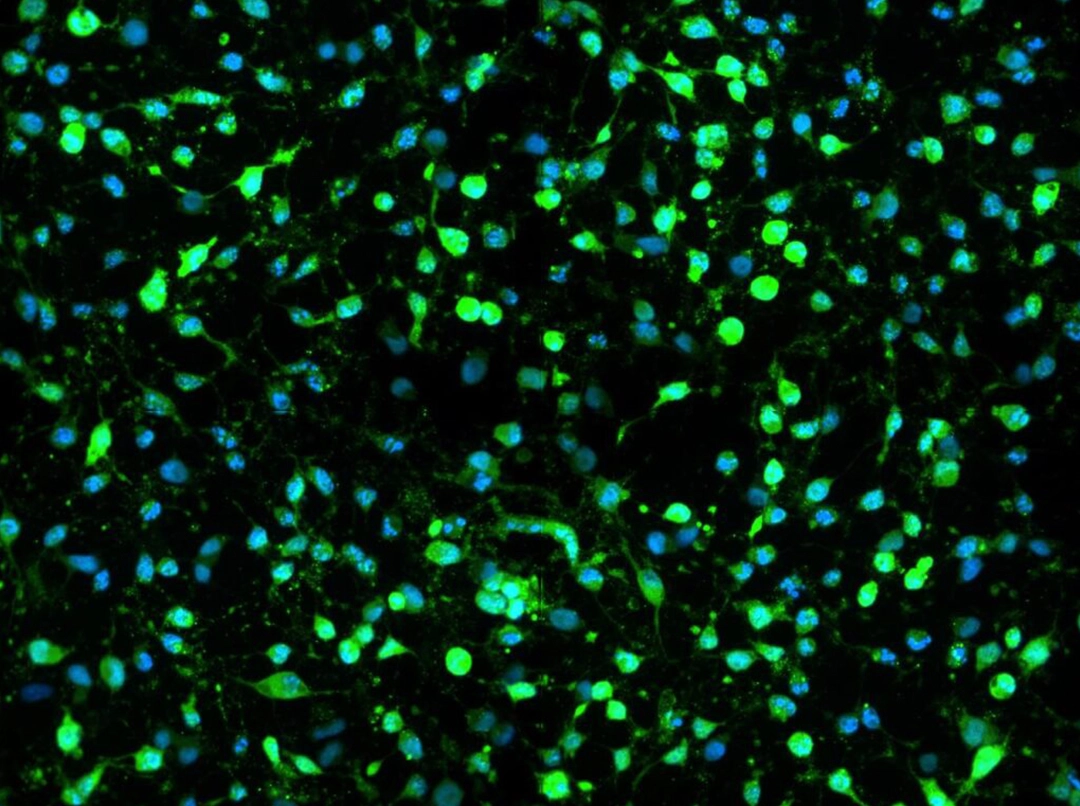
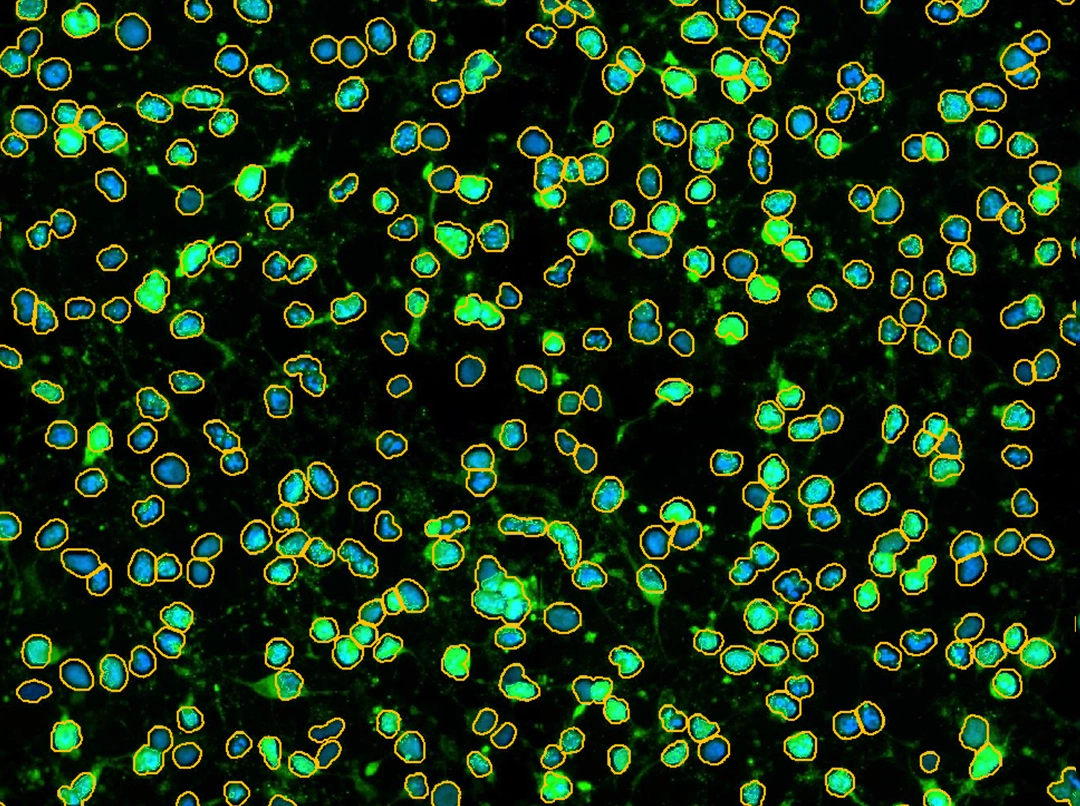
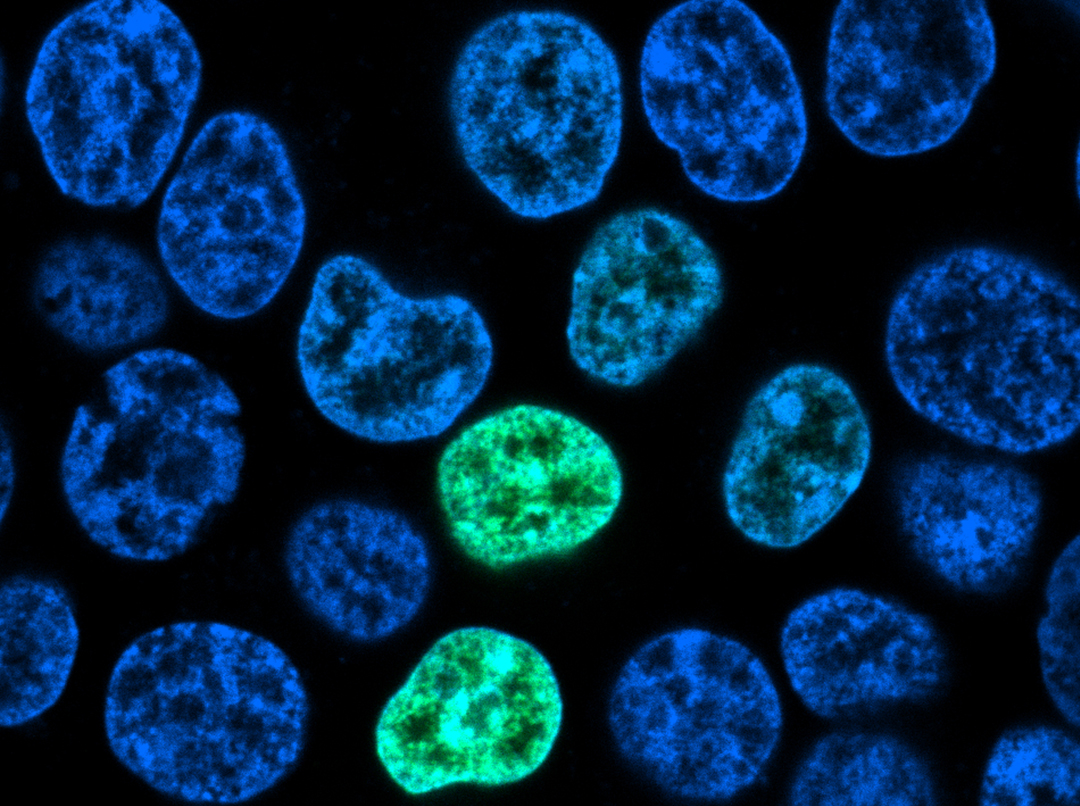
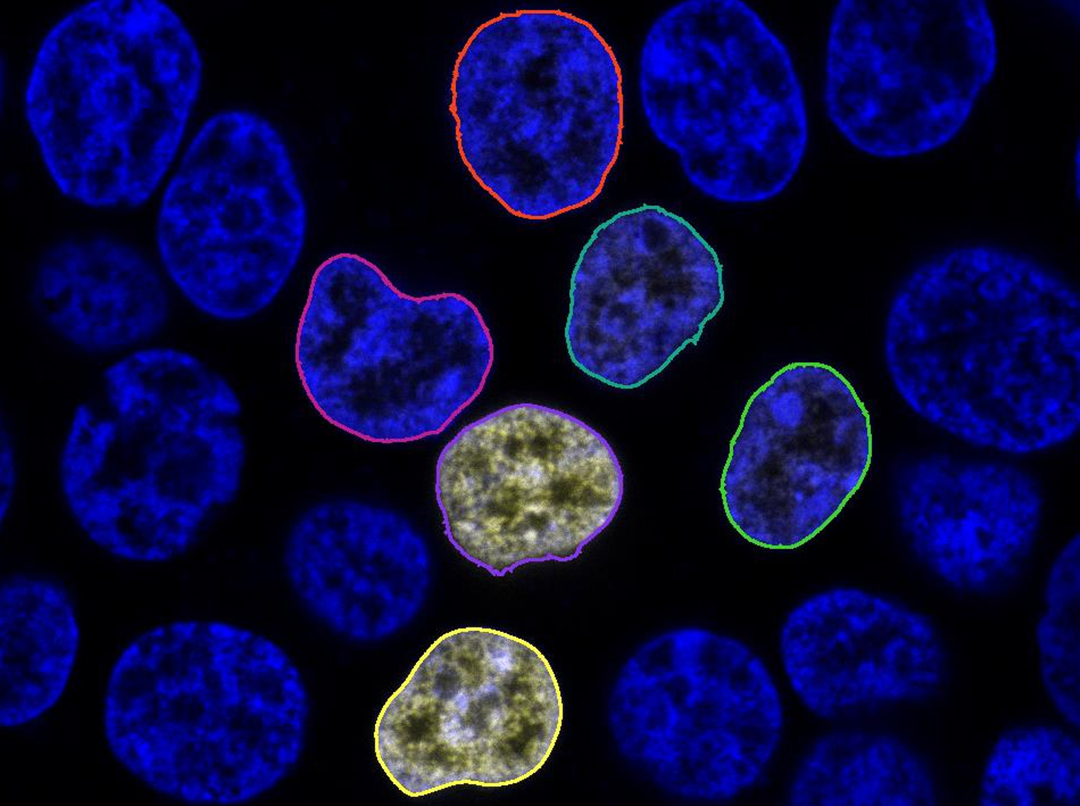
Count fluorescently labeled nuclei.
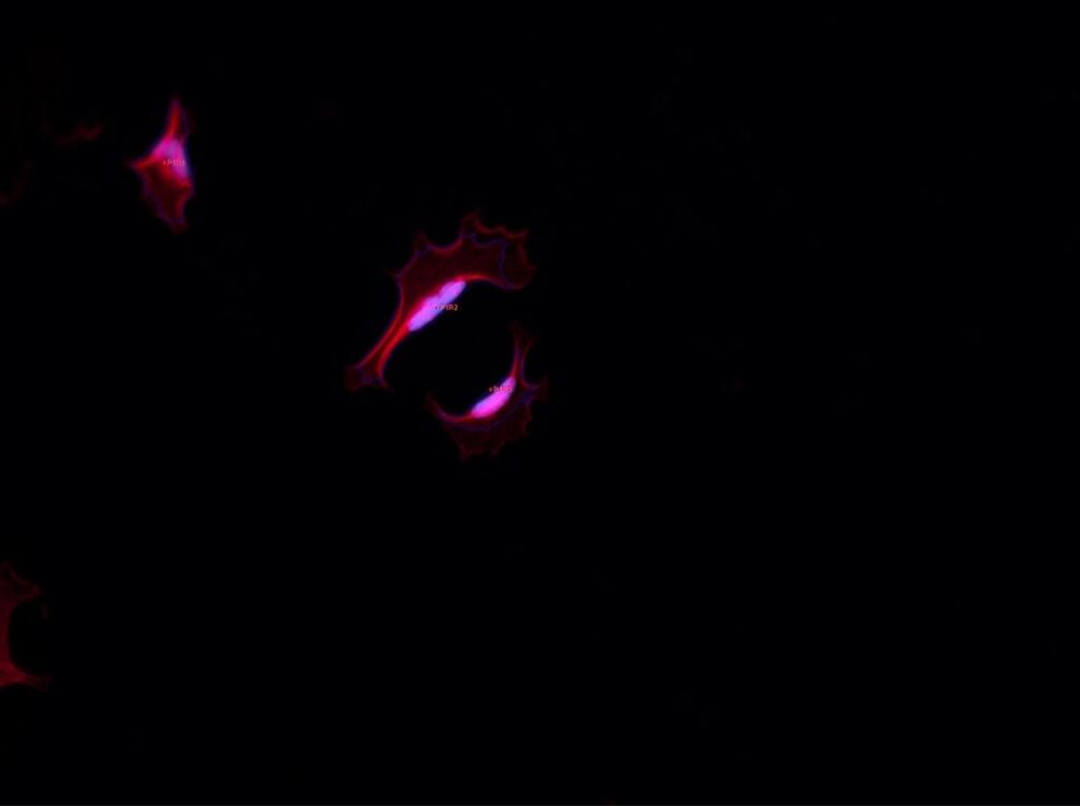
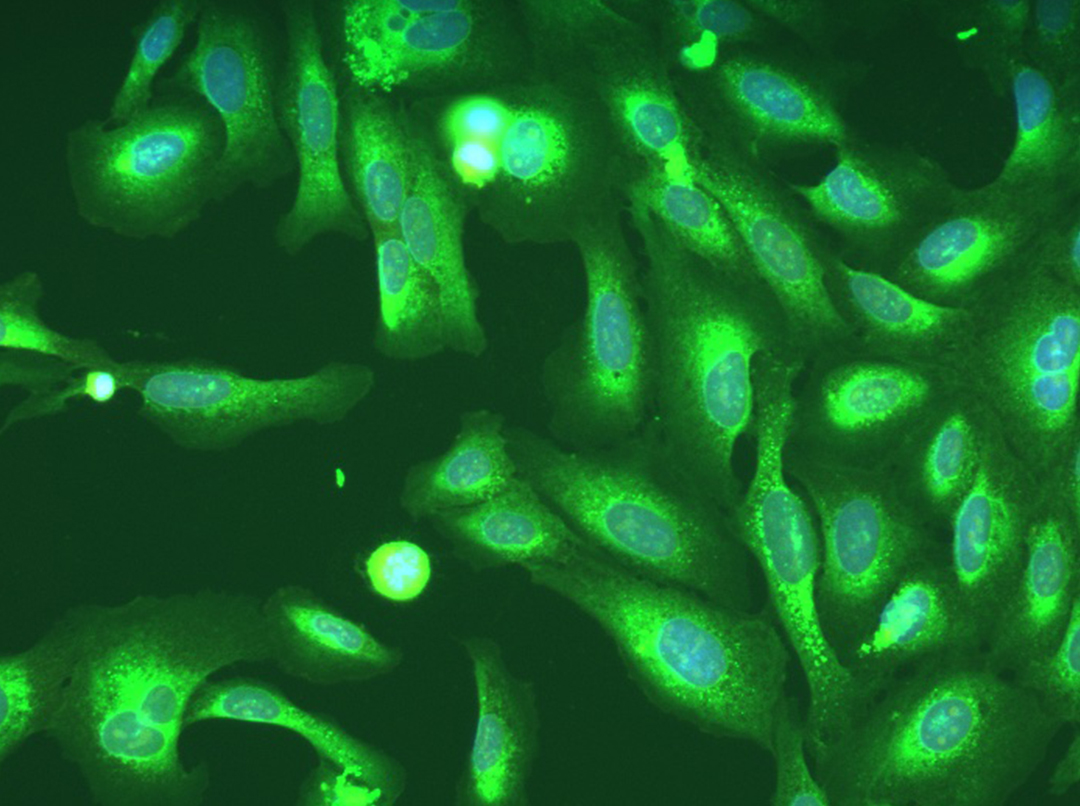
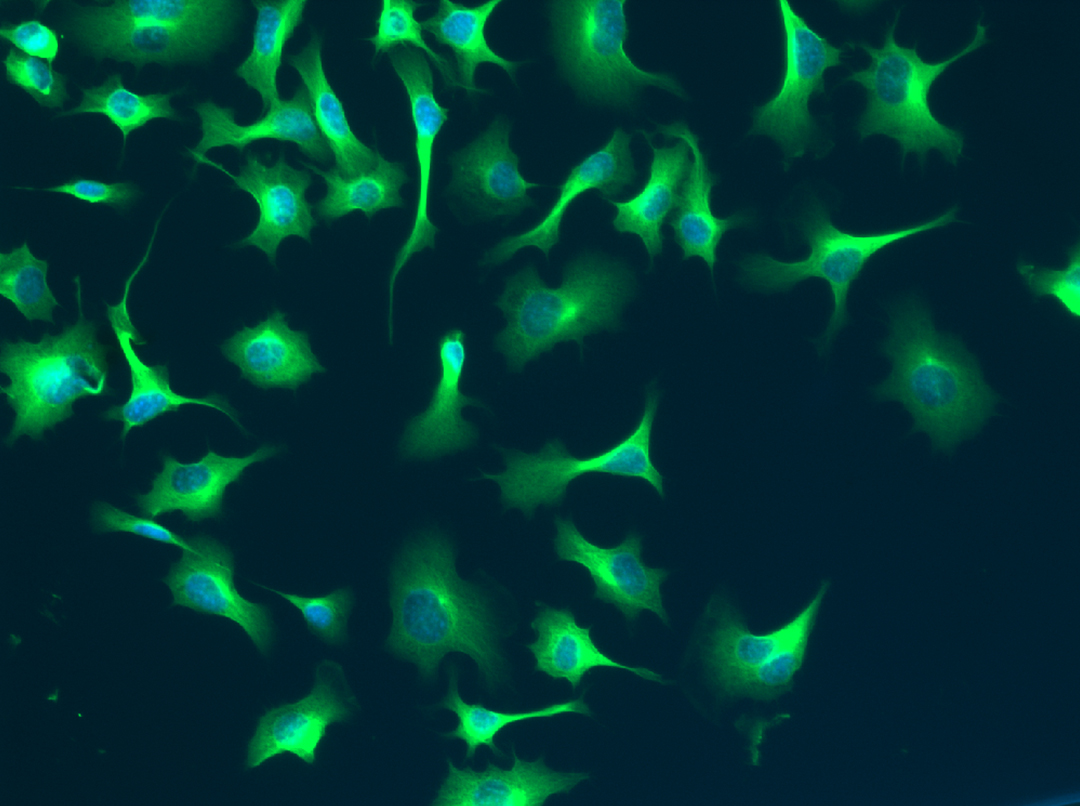
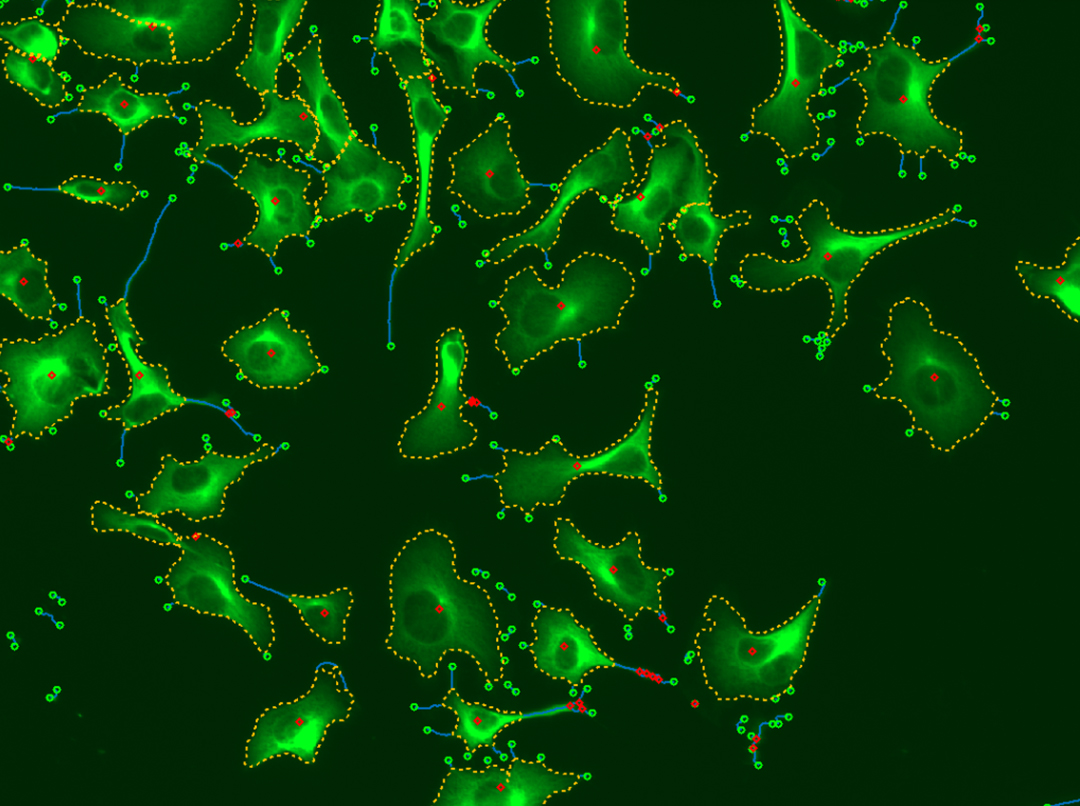
Measure the morphology of fluorescently labeled cells containing fluorescently labeled nuclei.
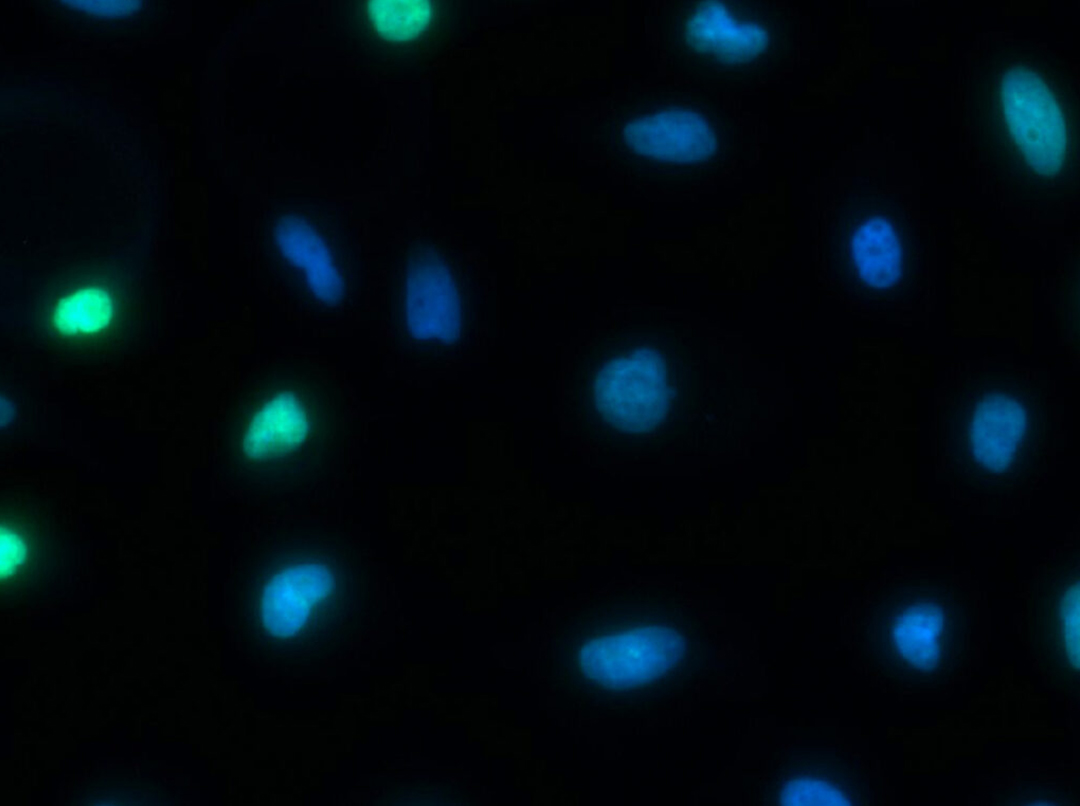
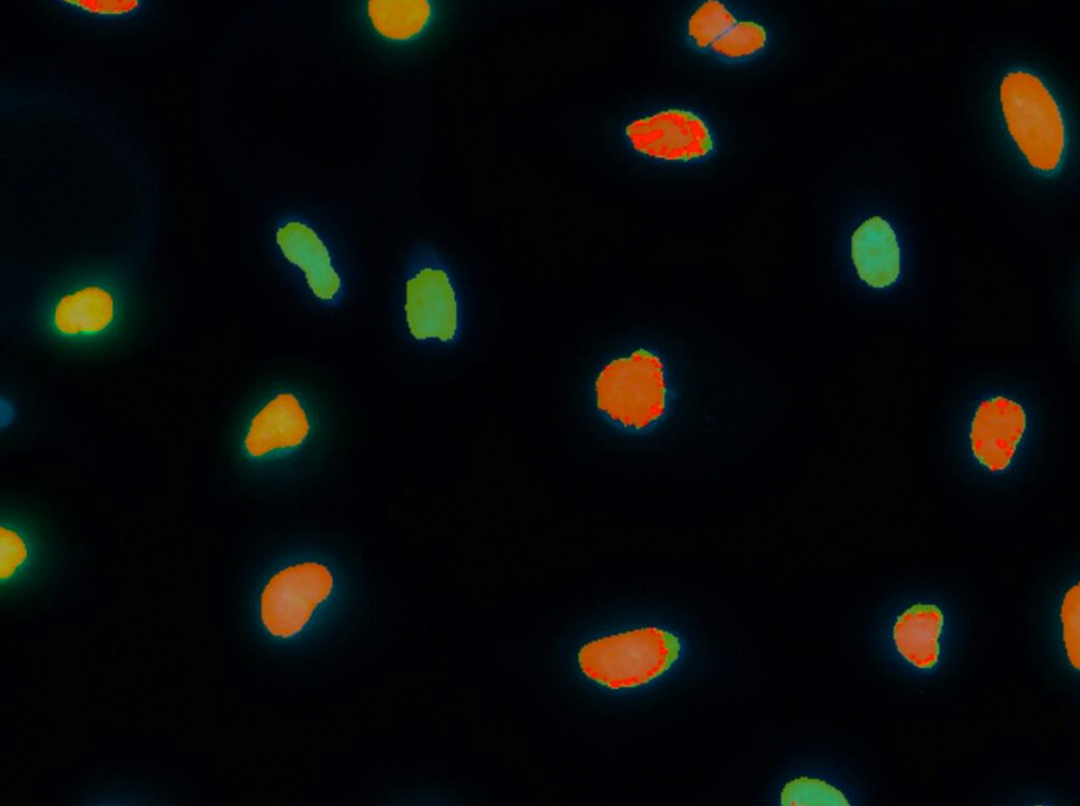
Measure the fluorescently labeled total cell population and the proportion of fluorescently labeled proliferating cells.
Measure the area and estimated cell count of cells in brightfield images.
Measure the proportion of fluorescently labeled cells that contain three or more fluorescently labeled lipid droplets (adiposomes).
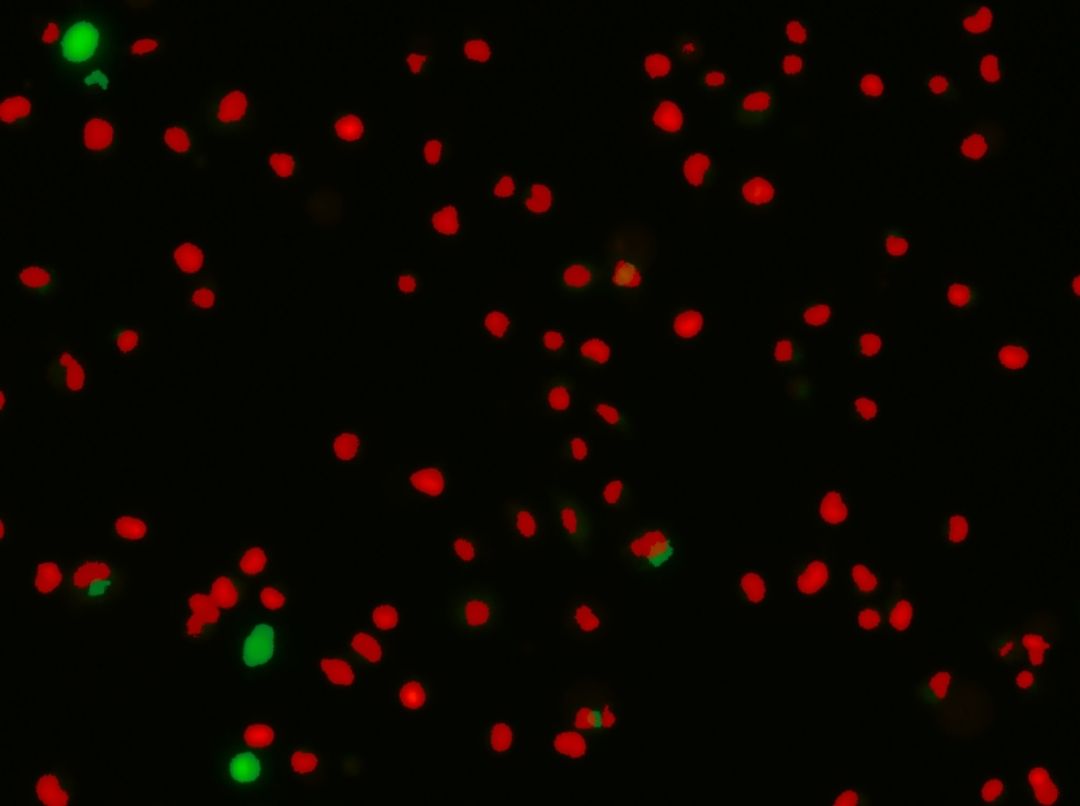
Measure fluorescently labeled populations of cells. Display as Total, Live and Dead (all cells), Live and Dead, Total and Live, and finally Total and Dead.
Measure a fluorescently labeled target within a ring mask outside, inside or overlapping fluorescently labeled nuclei, cells, or other structures. Use with 1 Ring and 1 to 2 Targets, or with a cell surface or plasma membrane ring mask and a cytoplasm ring mask.
Measure the proportion of cells in transmitted light images expressing a fluorescently labeled recombinant protein or 2 fluorescent labels.
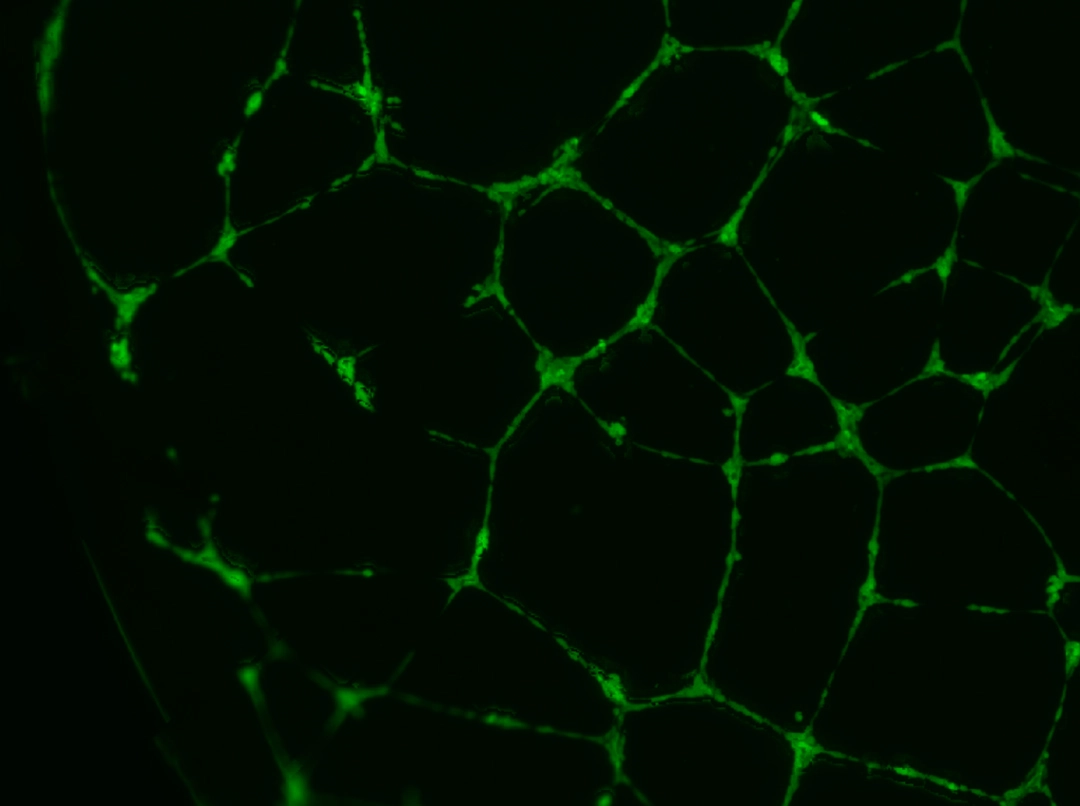
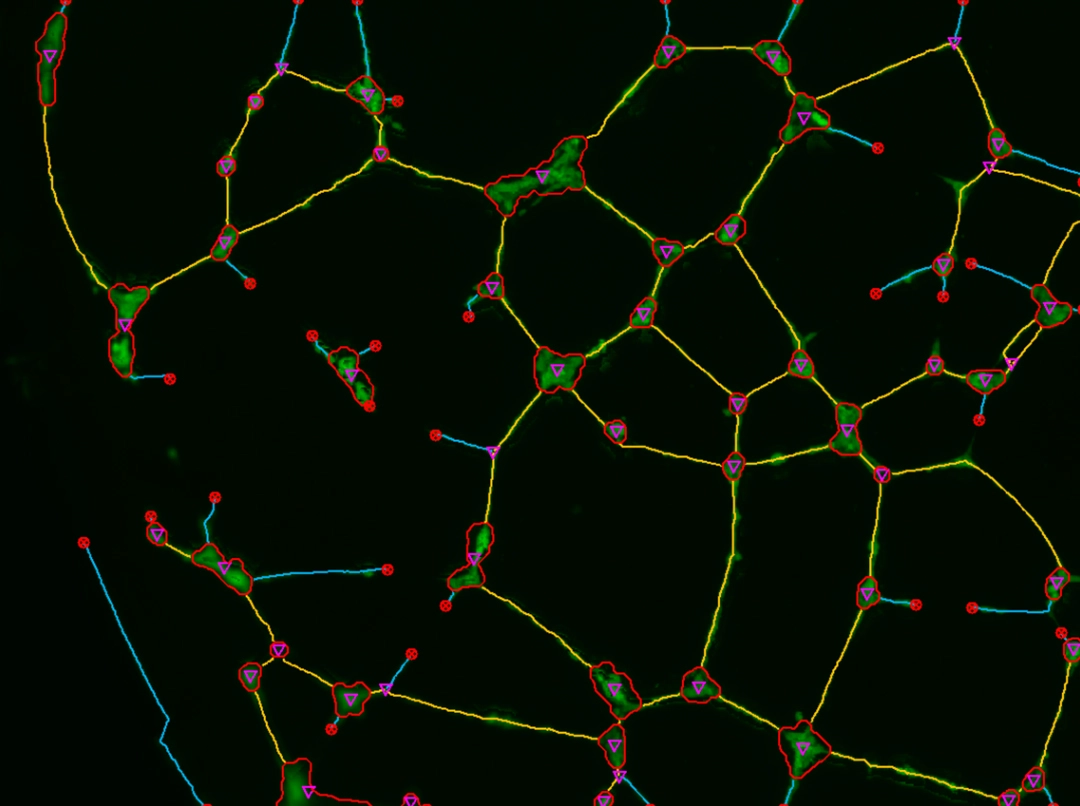
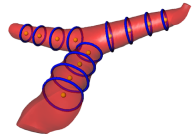
Measures the growth and diameter of fluorescently labeled blood vessels.
Measure the correlation and overlap of two fluorescently labeled molecules, both as object-based and image-based.
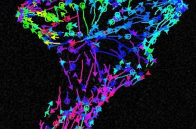
Measure fluorescently labeled neurons and cell bodies containing fluorescently labeled nuclei.
Measure either the total cellular area of transport of a fluorescently labeled target protein between fluorescently labeled nuclear and cytoplasmic compartments or just the area above threshold.
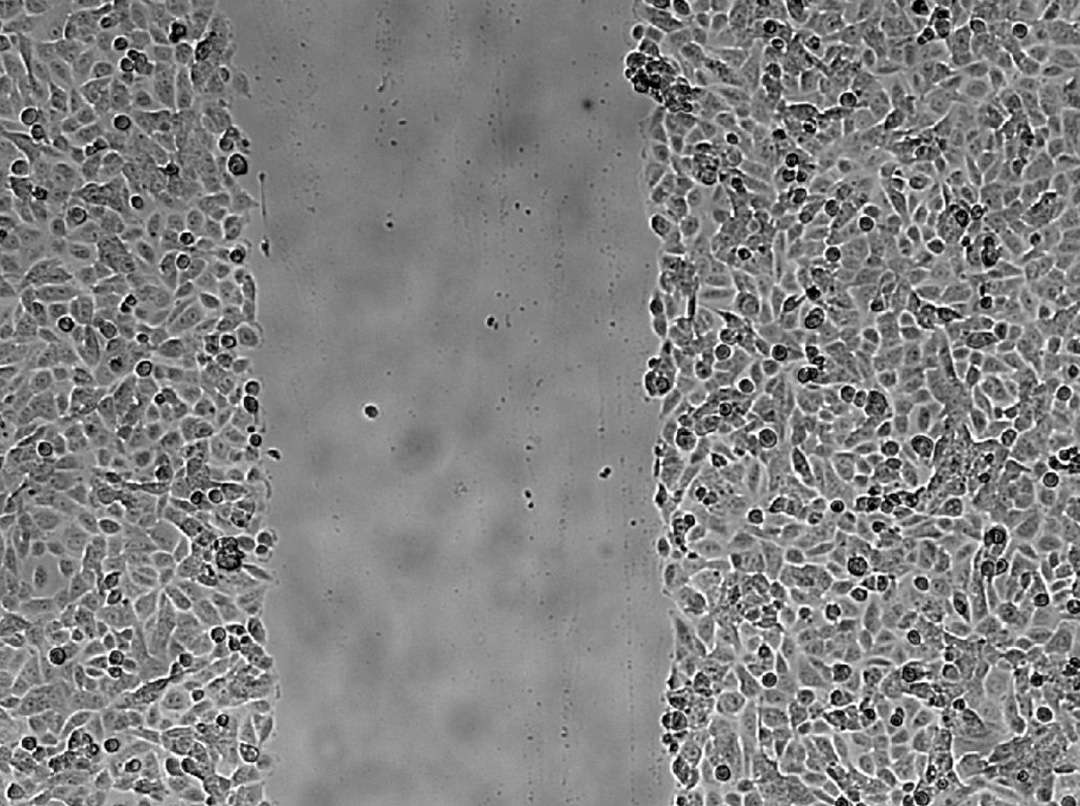
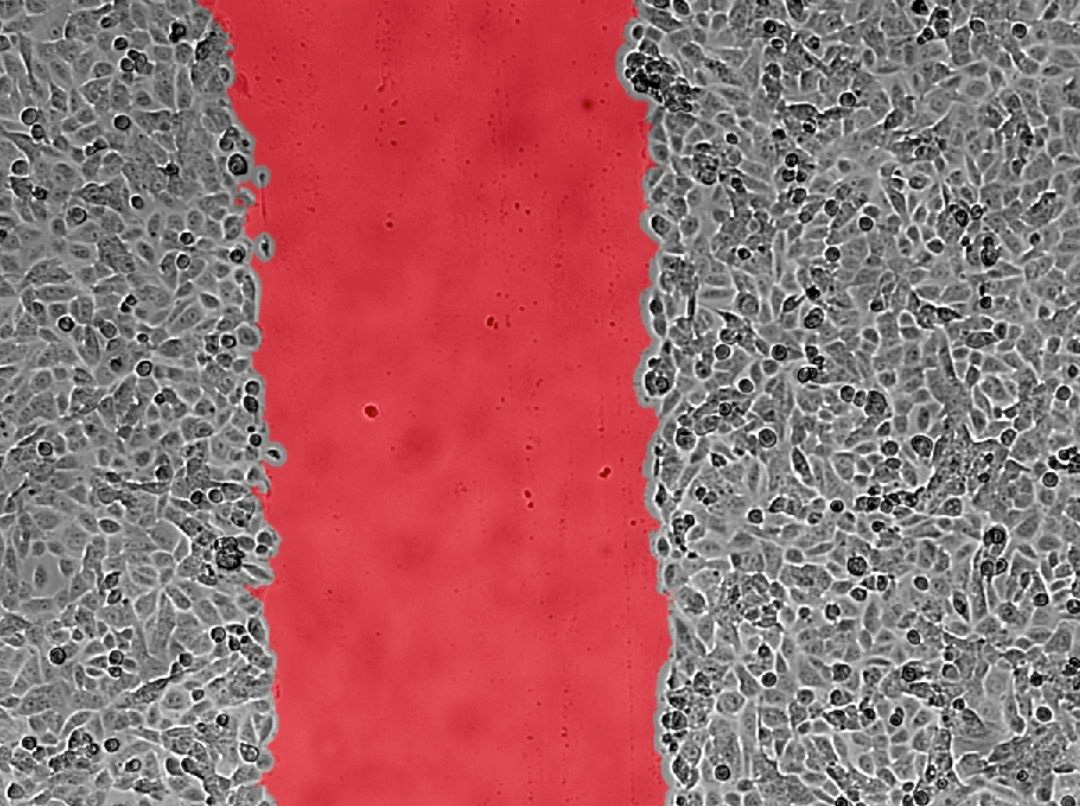
Measure cell migration rates as the gap left by a “scratch” closes.

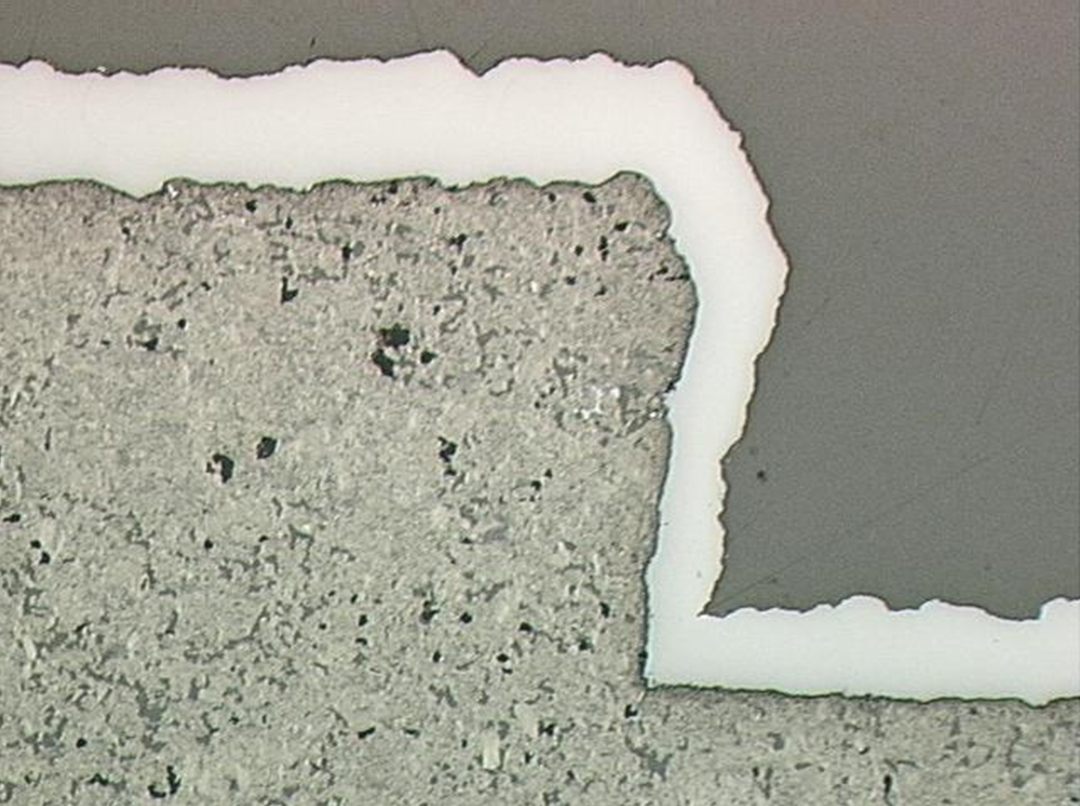
Measure the area of pores and constituents and calculate the area fraction of a composite material.
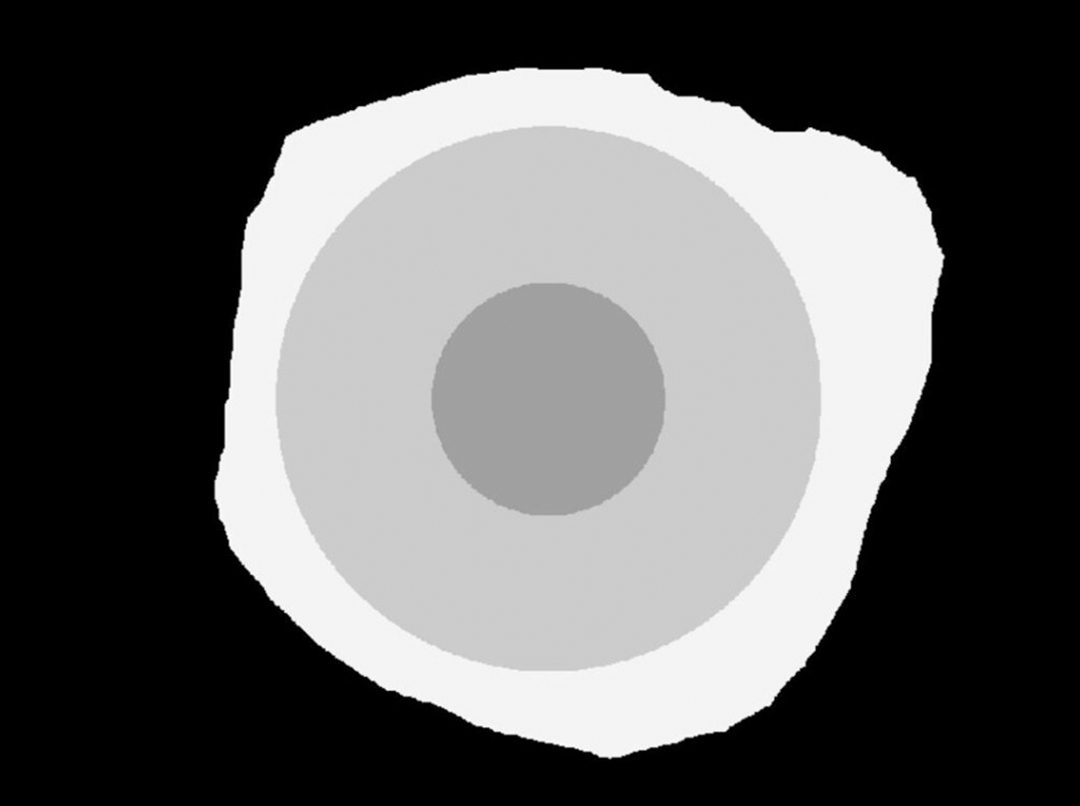
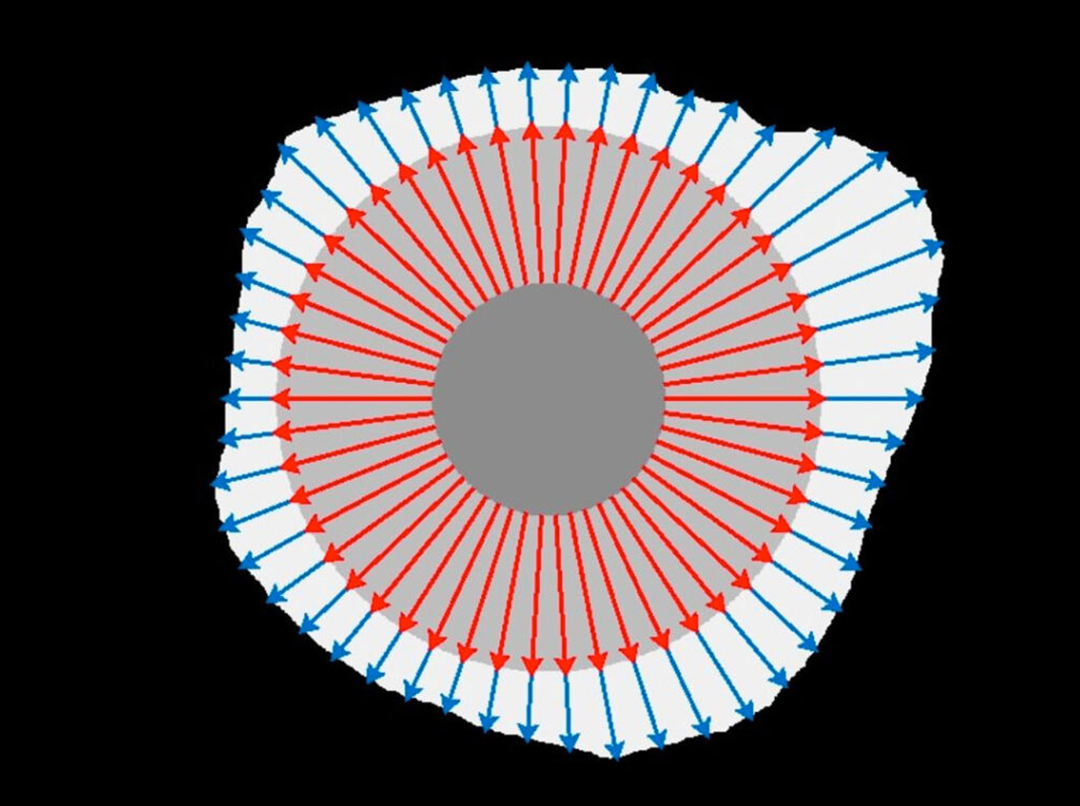
Measure the thickness of concentric layer(s).
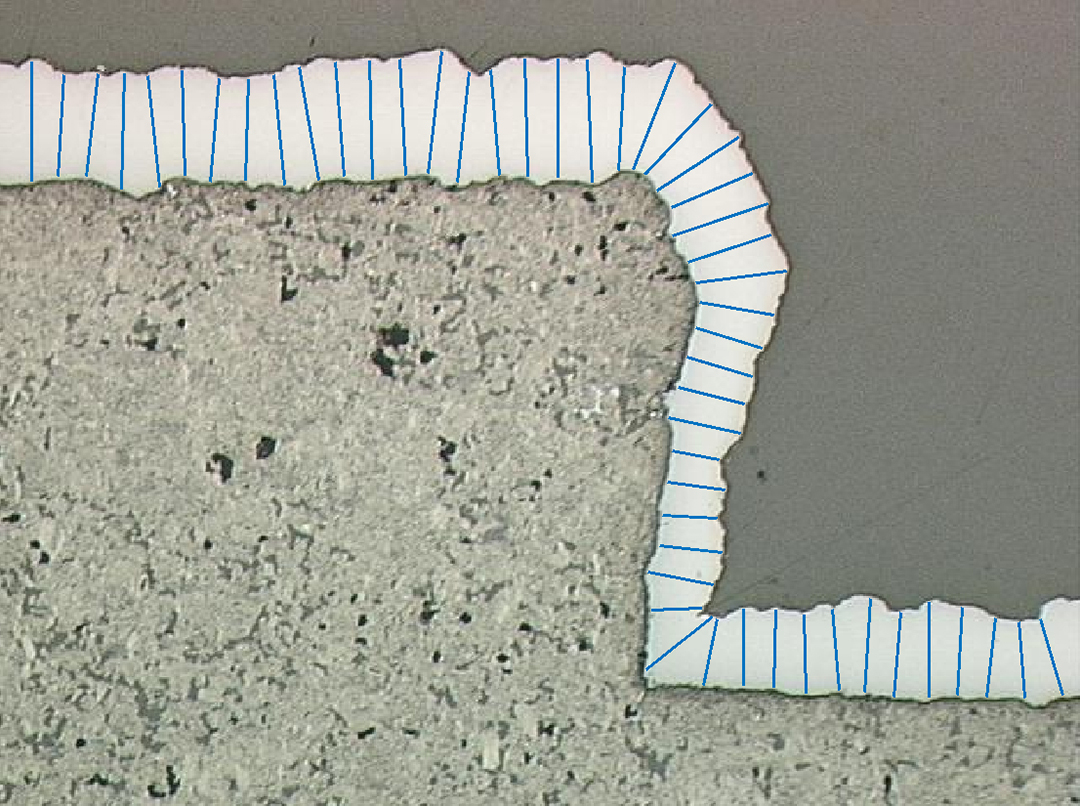
Measure the thickness of curved layer(s).
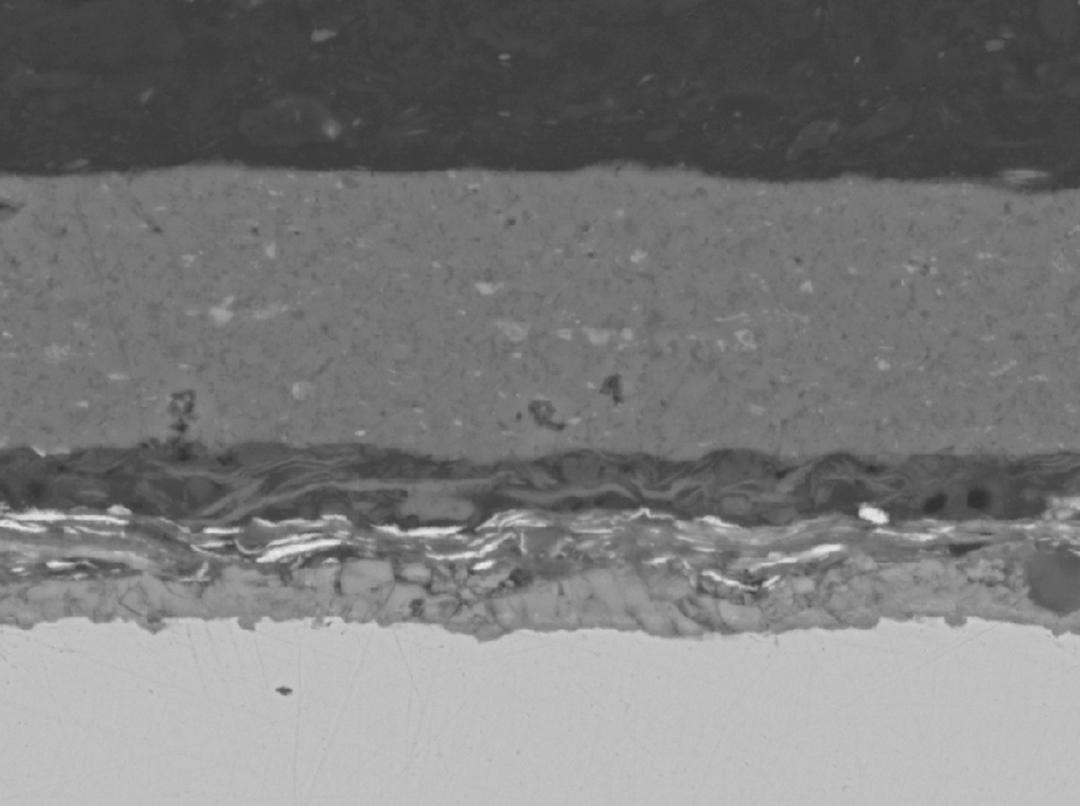
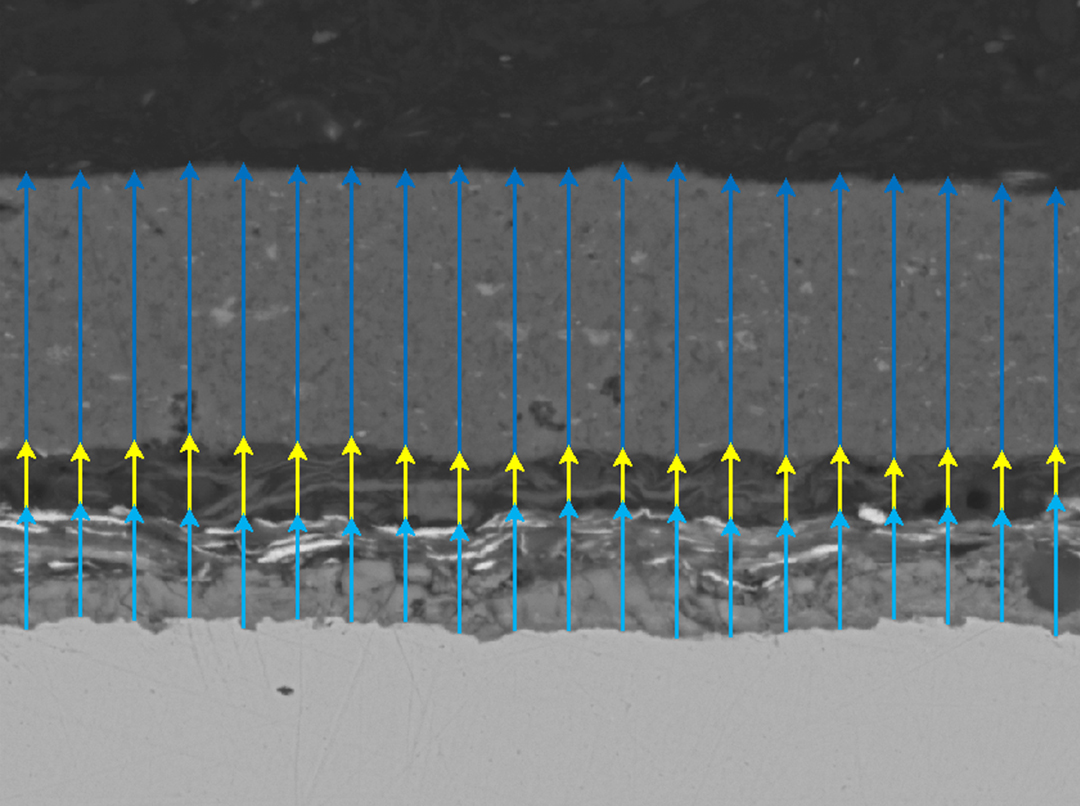
Measure the thickness of horizontal, vertical or curved layers.
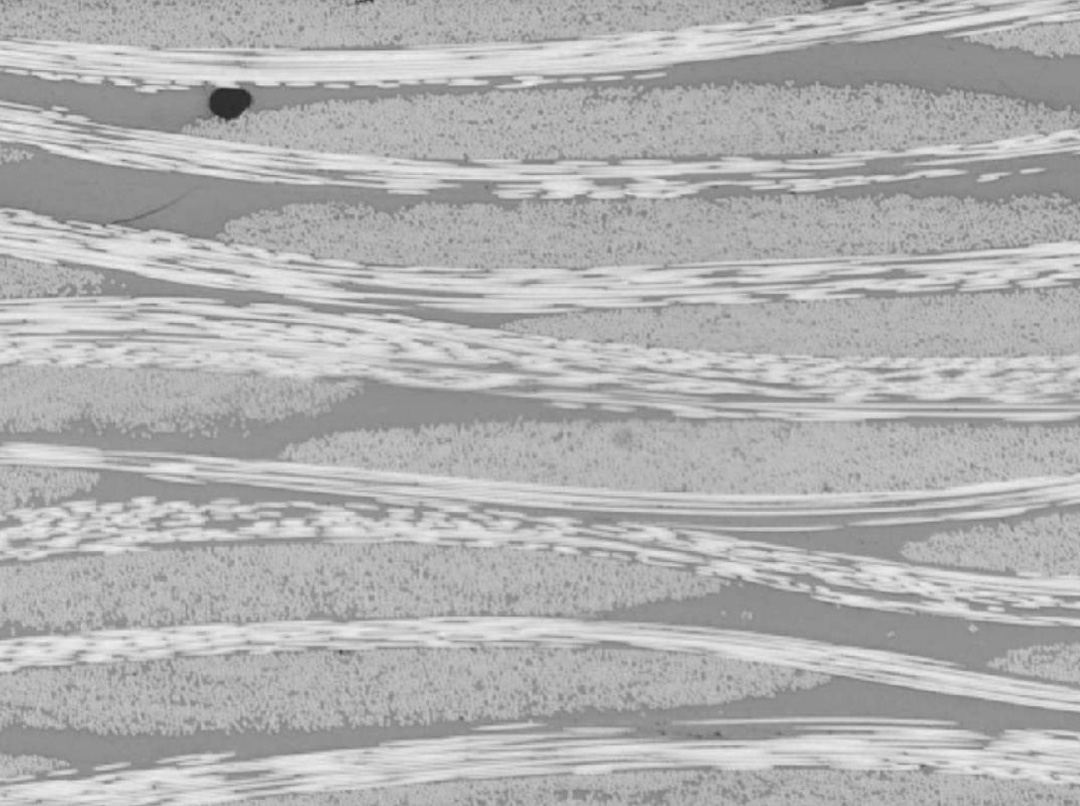
Separate crossing and overlapping fibers, and measure the fiber thickness, length and orientation in optical or SEM micrographs.
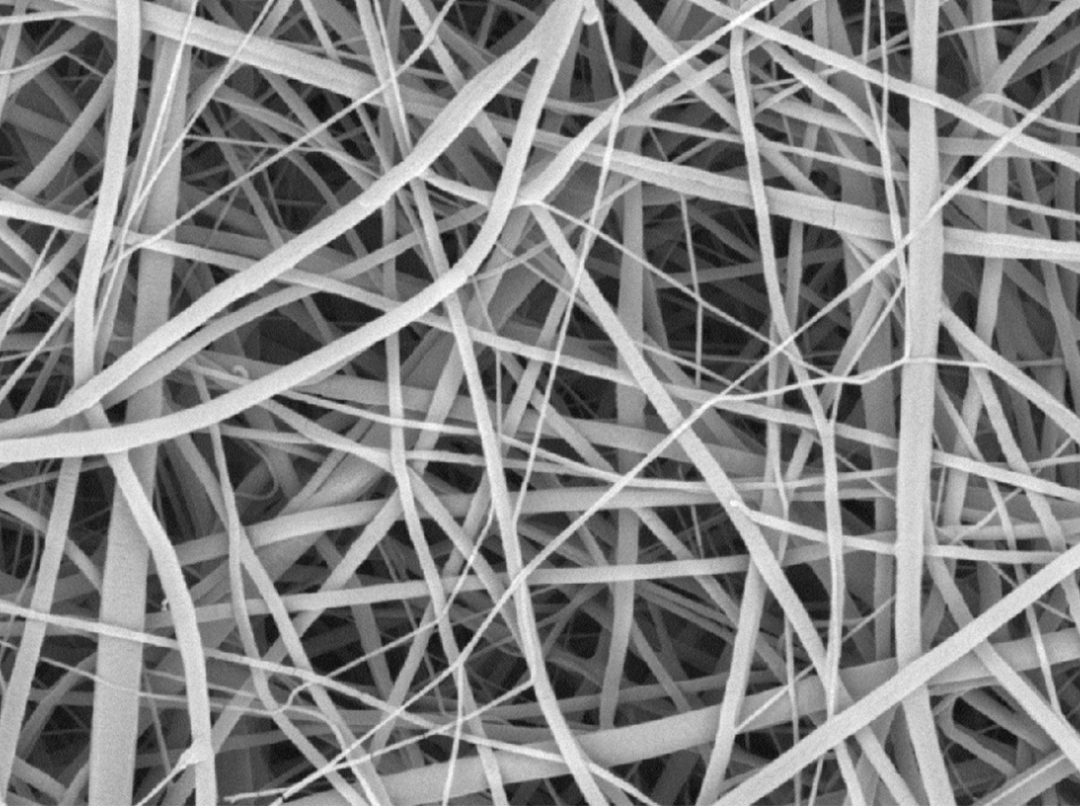
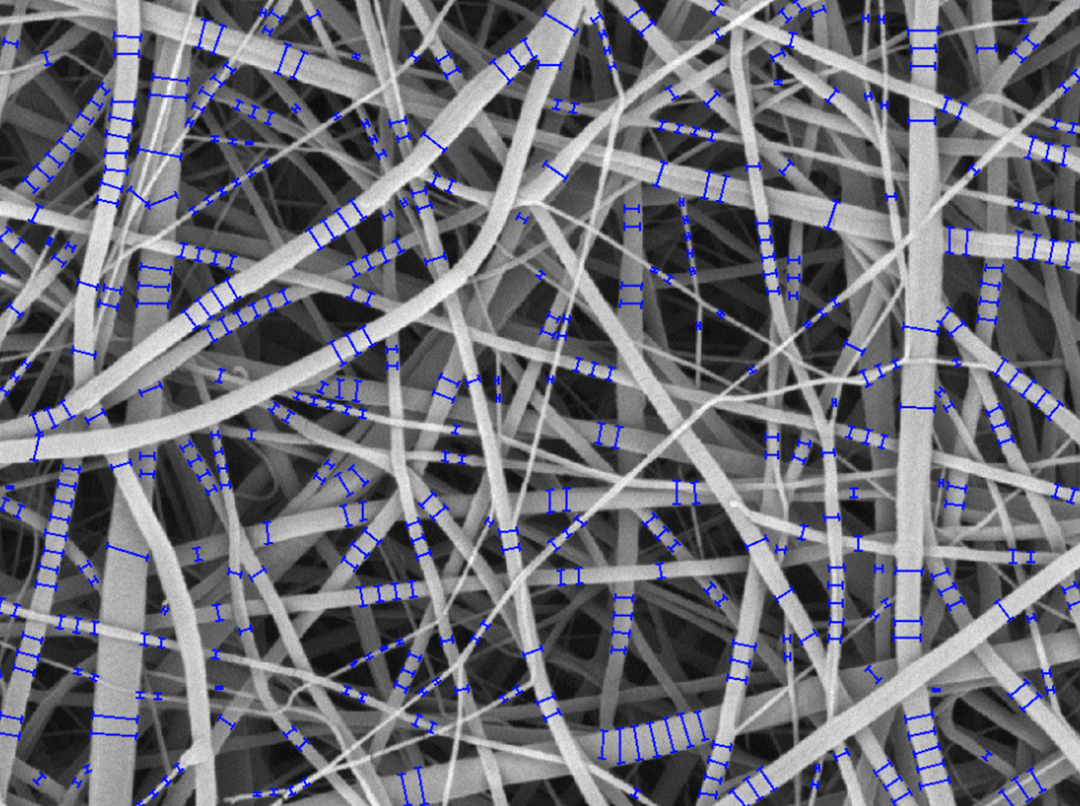
Measure both the thickness and orientation of fibers in optical or SEM micrographs.
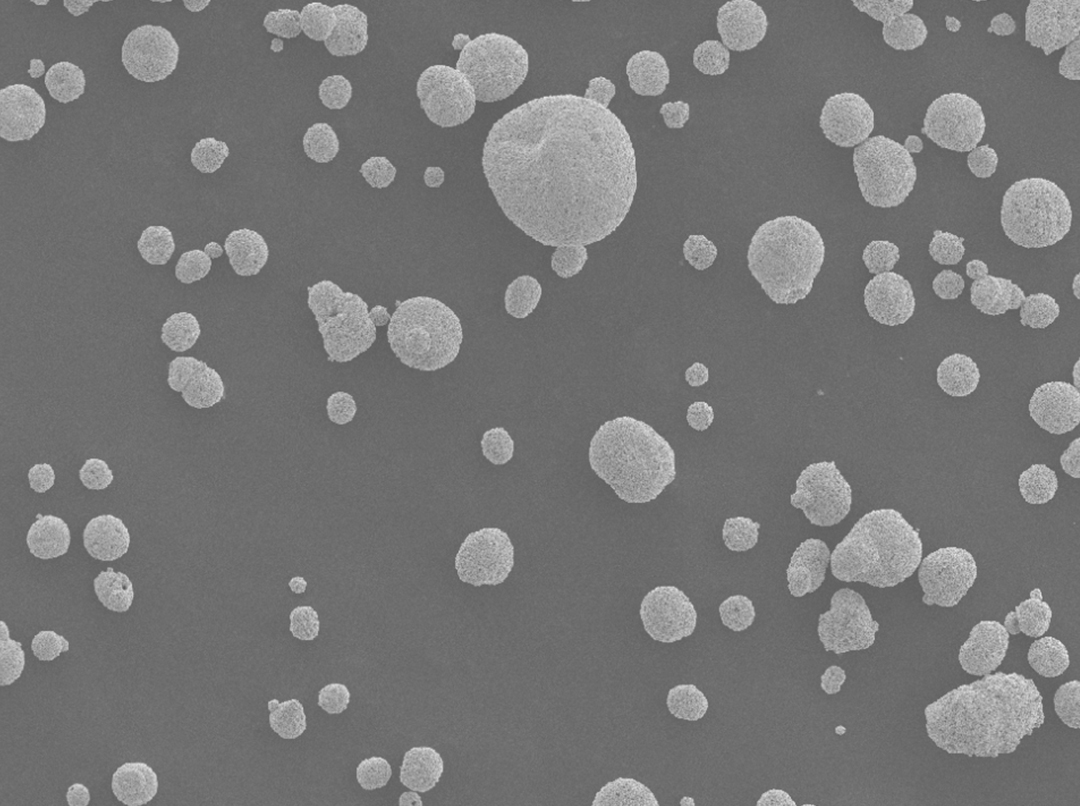
Measure and classify particles.
Measure the phases and calculate the area fraction with individual particles.
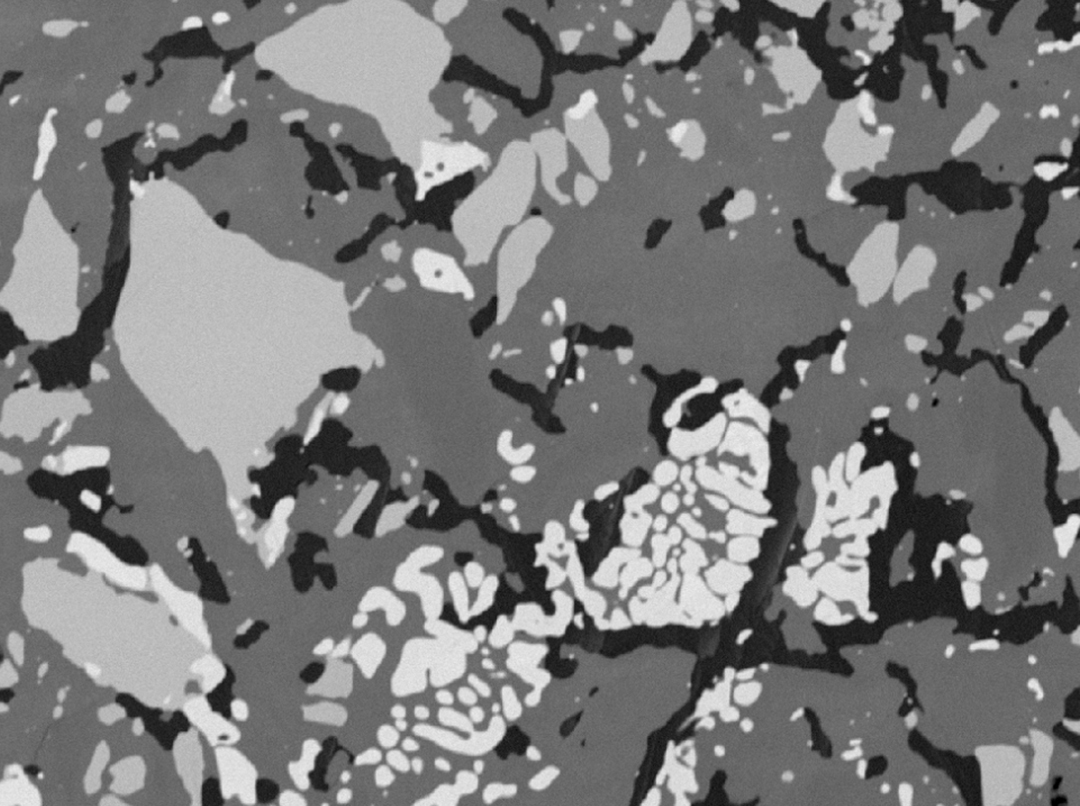
Measure phases and calculate the area fraction.
Measure pores in a range of materials such as composites, porous silicon and manufactured holes in substrates.
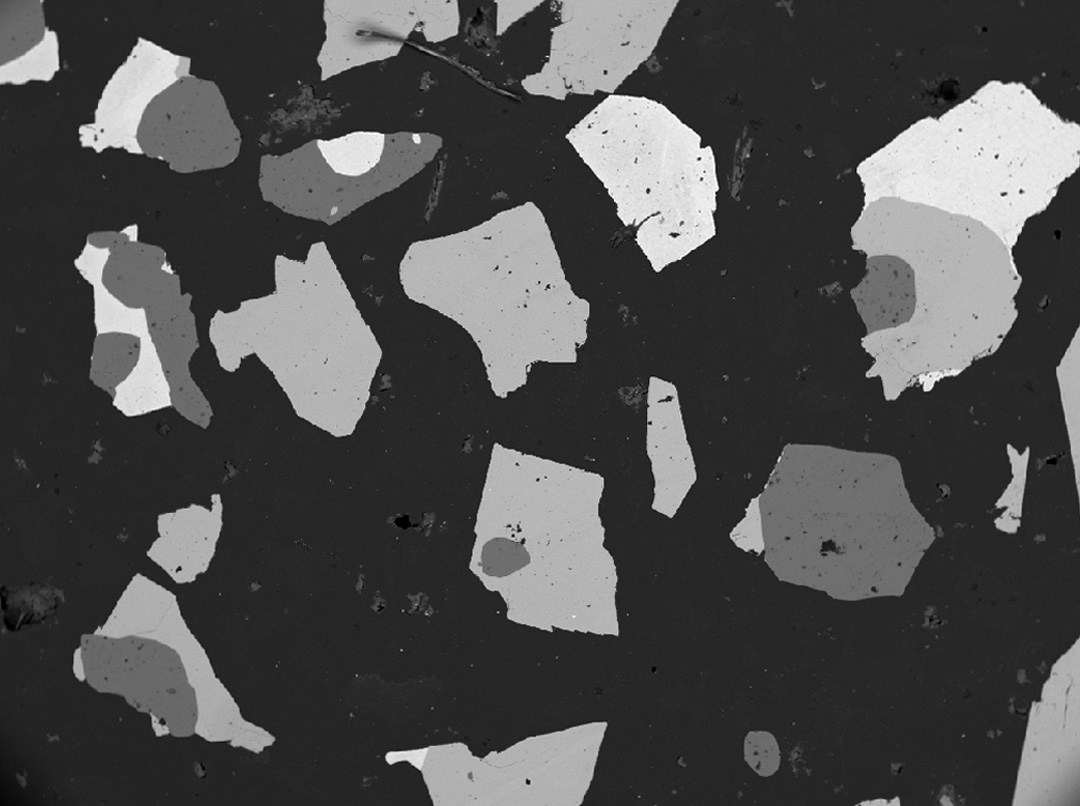
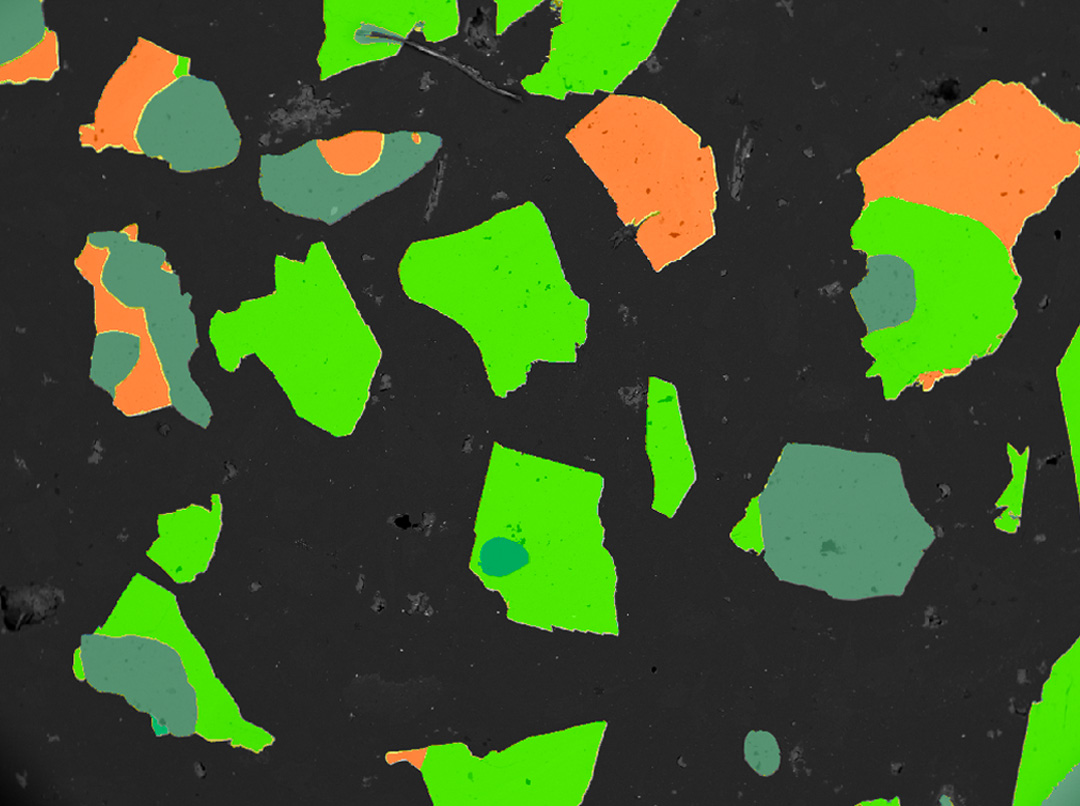
Whether using segmentation within a Protocol or as a free form segmentation tool, Image-Pro’s Smart Segmentation technology uses a proven method of pixel classification to identify hard-to-segment objects and regions.
Paint target classes and a background
Name your classes, easily identify representative pixels of your objects, and set a background. Paint more pixels to compensate for uneven backgrounds and colors across images.
Define recipe parameters
Build a unique “recipe” including Intensity, Color, Background, and Morphological Filters. For more complex samples, pre-apply custom filters for even better results.
Train over multiple images
It’s rare when one image fully represents a large set acquired over time, so Smart Segmentation uses a Global Recipe option that can be trained from multiple images in the set.
Filter by Measurement
Filter out objects to be counted or sized using specific range restrictions (graphically or numerically) by any number and combination of parameters.
Create object outlines
Once objects are identified and outlined you can count and measure areas, percent area, regions, intensity values, and more.
Split & Merge
Splitting objects that are touching is necessary in many images so use watershed or boundary shape-based splitting techniques when possible, or simply draw a split line to get the job done.
Learning Classification
Choose your reference objects, set the parameters to be used for building a classification recipe, and then automatically apply classes to all objects.
Auto Classification
Define groups to be created, choose the measurement parameters for the classification, and then apply hierarchical clustering to the objects.
Single Variable Classification
Define classification bins, set measurement ranges, and assign classes to objects according to the bin ranges they fall in. Use any measurement to classify objects by that “single” variable.
Measure Distances Between Objects
Measure one-to-one and one-to-many distances between objects.
Sort Counted Objects
Create a new image displaying all counted objects arranged by size.
Analyze the Spatial Distribution of Objects
Understand and visualize relative spatial distance between neighboring objects.
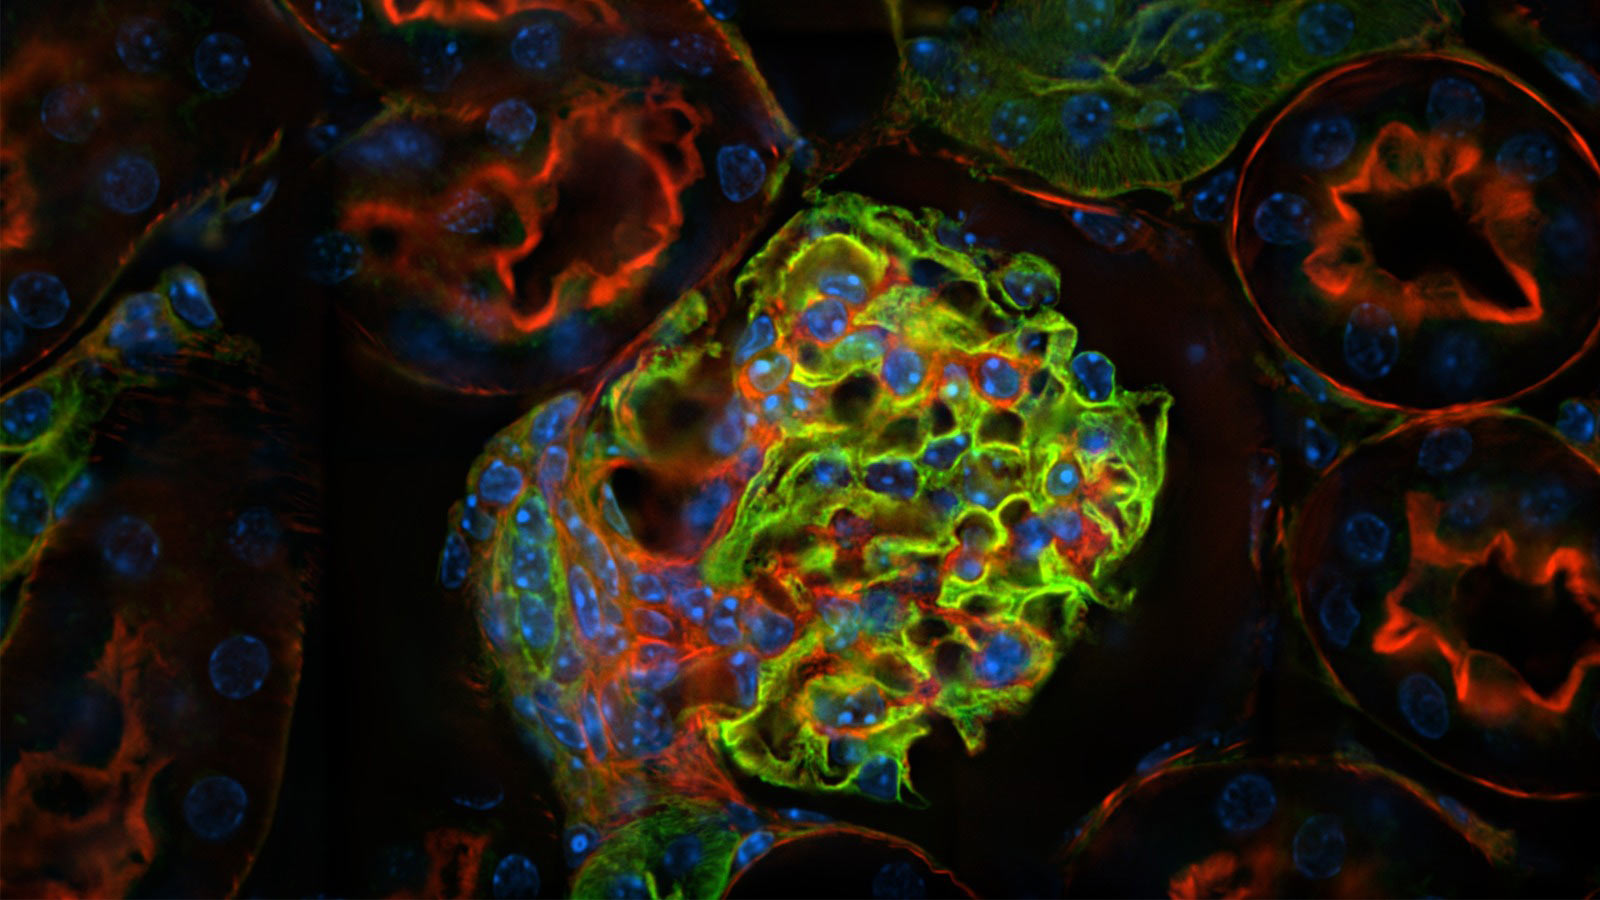
Multi-Channel Flourescence
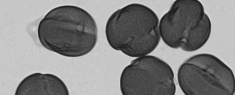
Mono Brightfield
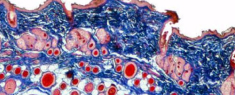
Color Brightfield
Macro Lens Photography
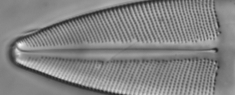
DIC/Phase
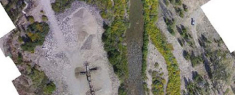
Drone Photography
Handheld Photography
Electron Microscopy
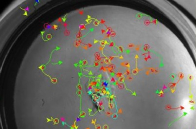
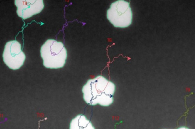
Auto Find objects with
Threshold SegmentationAdd Manual Tracks as
neededDefine a reference track
to base measurements onCompare multiple tracks
Auto Split touching
objects into independent tracksAllow shared objects
between tracksAccount for objects coming
in and out of focus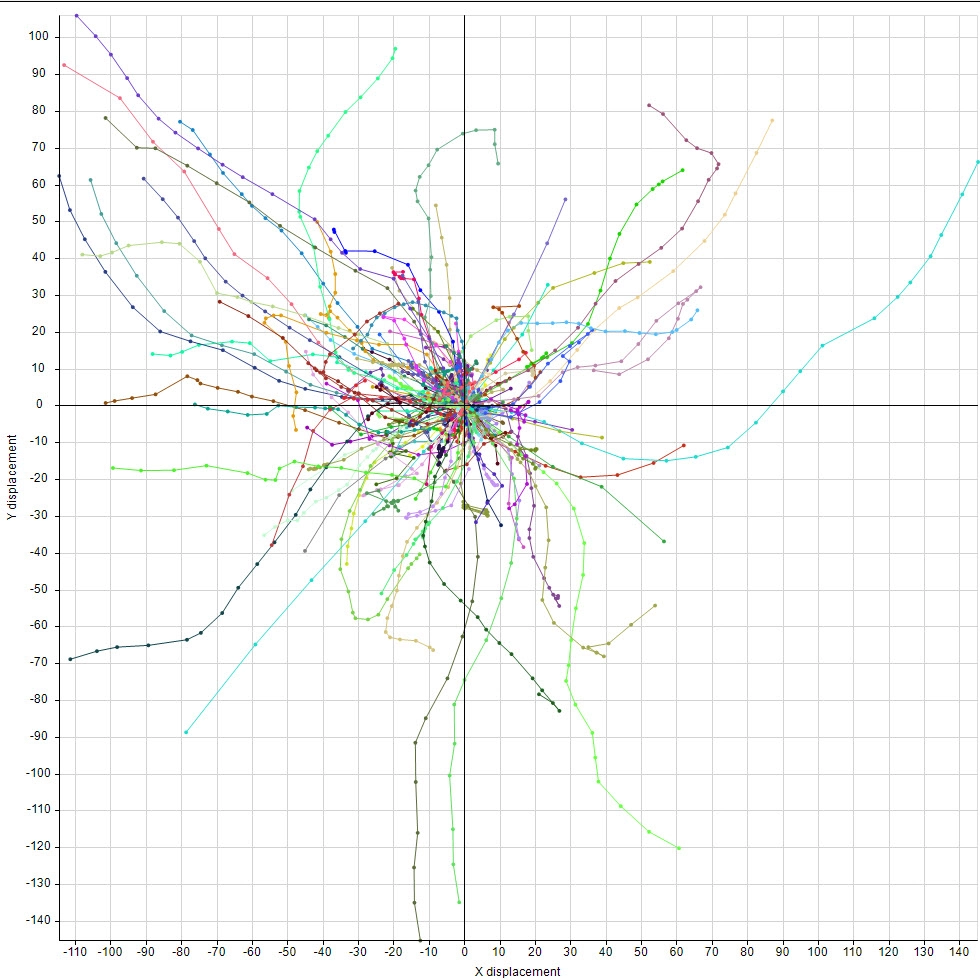 DistanceAccelerationVelocityDirection by angle &
coordinatesRelative timeObjects Morphology over
time
DistanceAccelerationVelocityDirection by angle &
coordinatesRelative timeObjects Morphology over
time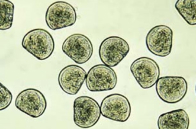
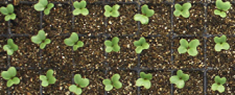
Hatchery Cultures
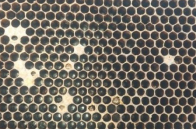
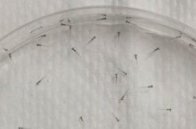
Bee Hive Activities
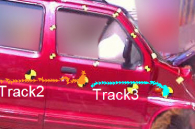
Crash Test Movement
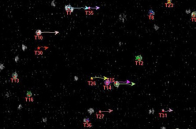
Particle Tracking
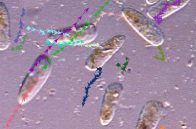
Paramecium Tracking
Zebra Fish Population Changes
C. Elegans Motion
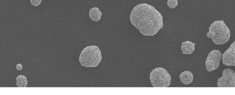
Gold Particles
Sperm Motility
Intracellular Tracking
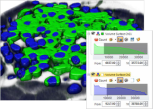
Choose from 144+ measurements to display in tables and graphs
Single Image Data Tables
Rename and adjustSort and condenseGroup by measurement or classView statistics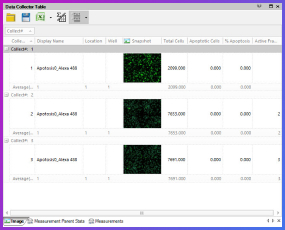
Multi-Image Collected Data
Collect data automaticallyKeep data linked to imagesGroup by imageGraph the results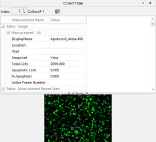
Block Tables
Line Graphs
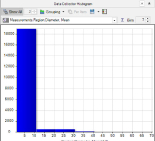
Data Histograms
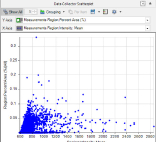
Scatter Plots
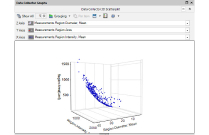
3D Plots
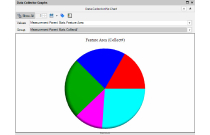
Pie Charts
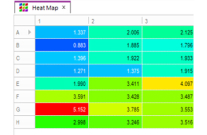
Heat Maps
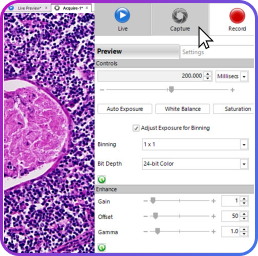
 2D Capture
Image-Pro’s Live Preview engine is a flexible image workspace capable of delivering high-speed video as well as layered measurements and overlays. Build up a focus map in real time and deliver stunning EDF images or stitch and tile on the fly with Live Tiling.
Capture beautifully focused images, regardless of depth, with Live EDF. No automated z motor is required.
Stitch together multiple fields of view as you manually navigate your specimen. Combine with Live EDF to create a focused, tiled image. No automated stage is required.
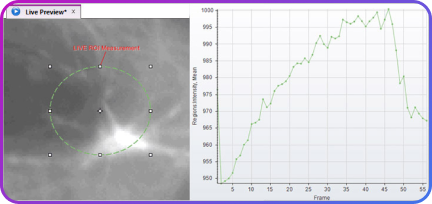
Measure areas of objects or distances between objects on your live preview images. No need to capture your image. *Requires 2D Measurements Module
Compare live images with previously captured images and analyze their differences or tint and visualize the changes that have occurred over time.
Use the Calibrated Grid overlay to ensure alignment while capturing or to quickly measure sizes and gauge distances. Select from a range of patterns and colors to fit your needs.
Our partnership with leading camera and microscope manufacturers means the widest possible device support for the devices your lab already utilizes for image capture.


Image-Pro supports an ever-growing list of scientific cameras to ensure a superior capture experience. Browse the extensive database of supported devices.
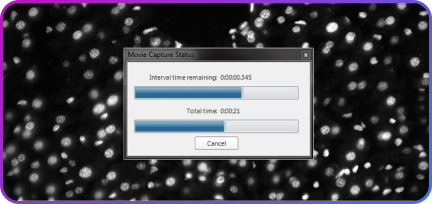
Instantly capture images and much more while live preview is running. Other capture programs pause the live preview, leading to potential data loss, but Image-Pro’s Instant Acquisition technology ensures you reliably capture important events.
Capture a sequence of images at different exposures, with variable options, and combine them into a single High Dynamic Range image. The resulting image is a compilation of image data using the widest possible range of dark to light pixels. No more black or saturated pixels.
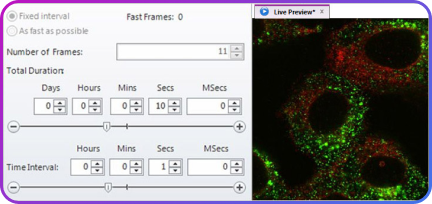
Record quick events or long-term experiments. Replay your recordings and display informative timestamps and overlays. Easily save movies as .AVI, .TIF or .WMV formats.
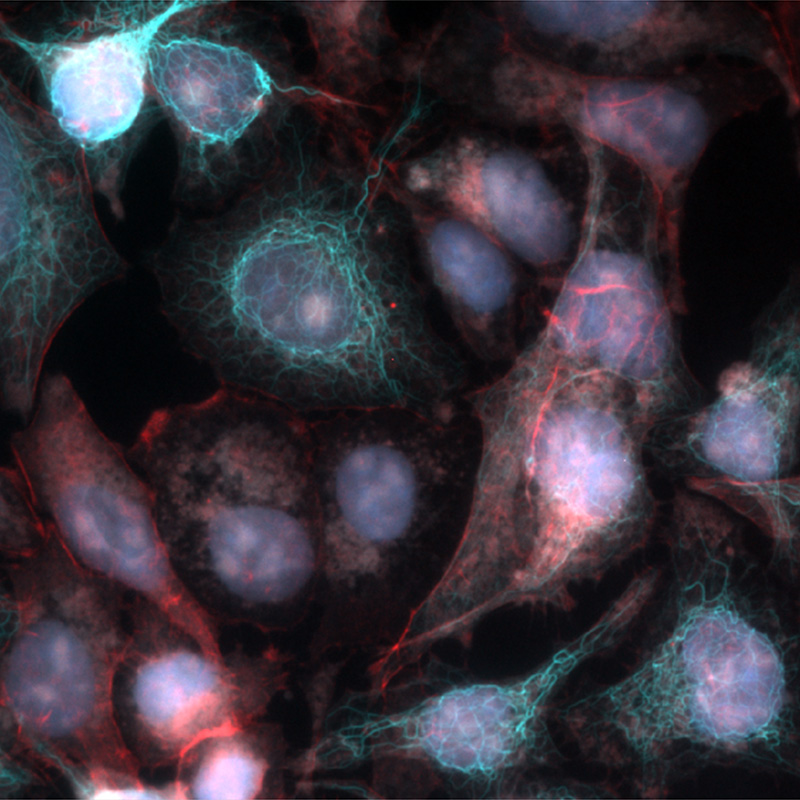
Supercharge Your Manual Microscope to Capture
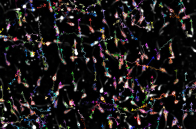
Multi-Channel Fluorescent Images
Multi-Channel Capture
Whether in MANUAL or AUTO Mode, this extension to the 2D Capture Module will expand any microscope and make it capable of capturing multiple channels into an image set. Whether capturing single snaps or movies, simply set up your channels, start the capture, and Image-Pro will prompt you to change the filter or light source when needed. Finish the session and your set is combined, color-tinted, and ready to view or measure. A simple, yet powerful way to capture.
Manual Mode
Define your channels and control the lighting by hand with guided prompts. Capture multiple Brightfield modalities in one set or manually control a fluorescent light source.
Auto Mode
Connect a supported Light Source (such as the CoolLED pE-300) and retrofit/upgrade your existing microscope to automatically capture fluorescent images. See how we provide end-to-end solutions for Life Sciences.
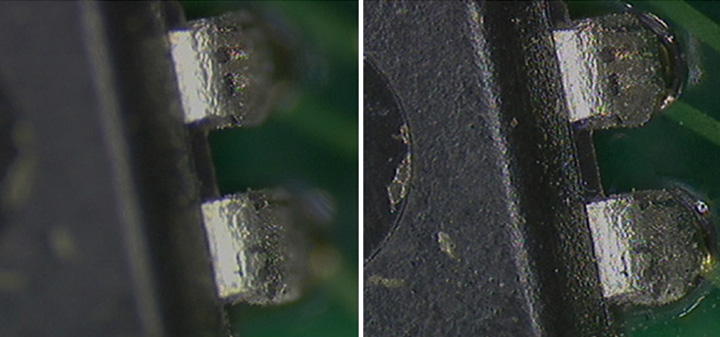
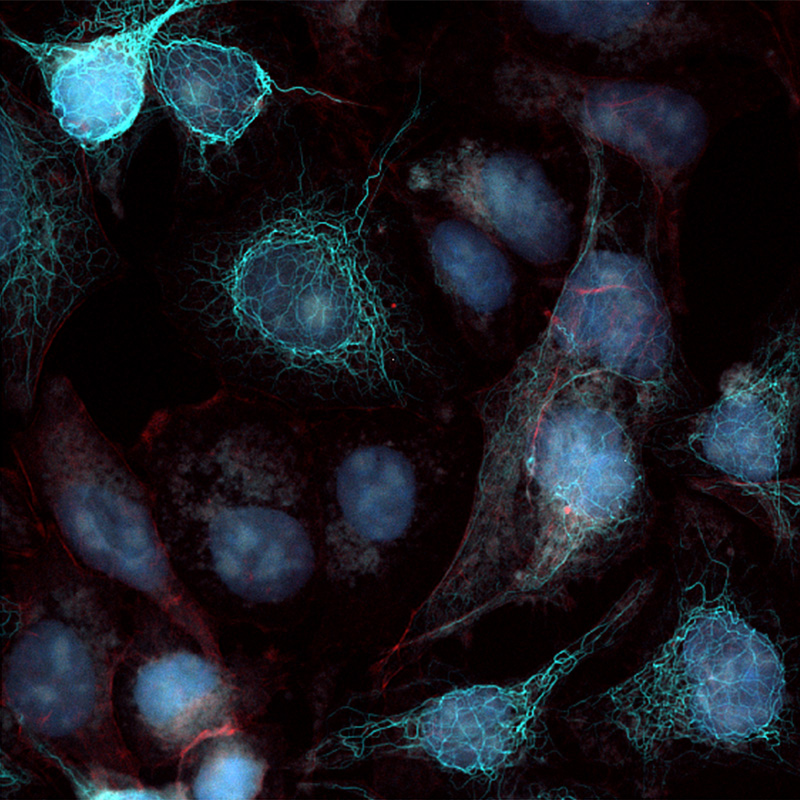
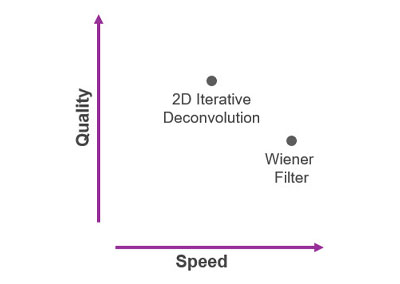
The optional Real-Time Deconvolution extension leverages industry-leading AutoQuant technology to cost-effectively “upgrade” your existing widefield microscope to obtain images almost as clear as those from more expensive confocal microscopes. Elevate your capture system to now deliver crisp, high fidelity, fluorescent images during preview and capture.
Two algorithm options give you the control between speed and quality: 2D Iterative Deconvolution for higher quality, and Wiener Filter for higher speed.
Auto Exposure, White Balance, and Saturation Warning (both High and Low) are standard features for all devices in Image-Pro. Where possible, Binning and Bit Depth options are also enabled, and exposure can even be automatically adjusted based on the binning selection.
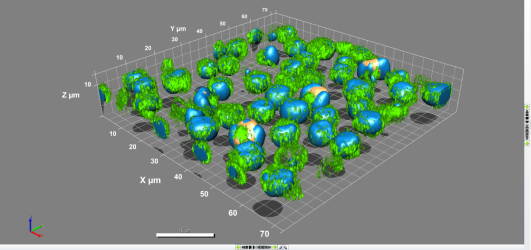
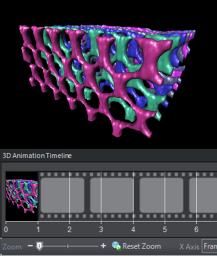
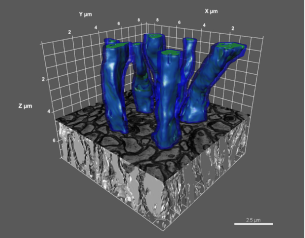
 3D Visualization & Analysis
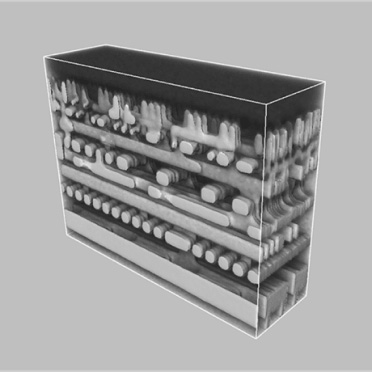
Volume Adjustments
Object Parameters
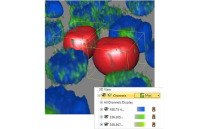
Channel Parameters
Change Backgrounds
Change your background and apply gradient bleeding to create the highest possible contract between your data and the background.
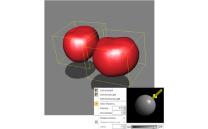
Adjust Lighting
Control your volume's light in two different directions with intensity, color, and angle adjustments.
Apply Shadows
Shadow Projections can produce shadows on 3 walls of the volume frame and accentuate the morphology and interaction of objects.
Remove Regions
View the interactions of various materials by clipping away distracting or unnecessary regions using a Volume of interest.
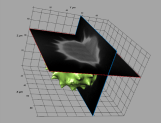
Adjust Orientation
Create any number of clipping planes and easily traverse the axis of orientation. Reveal what a 2D plane in any position looks like or turn clipping on to erase data before or after the plane.
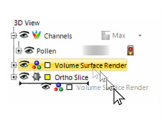
Arrange Priority
Select any clipping plane in the 3D View Panel and move it above or below other clipping planes or 3D elements to adjust the clipping priority. Items on top clip all those below it, it’s as simple as that.
Pre-loaded Templates
Sharing
Custom Animations
* File size is limited only by free storage space (see system requirements for 3D Virtualization Module)
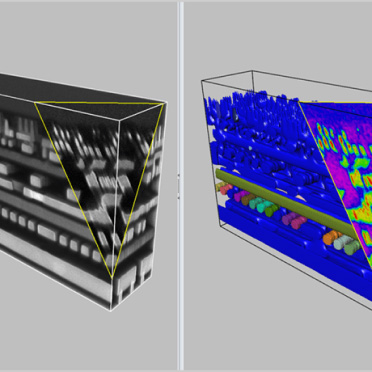
The Big Data Visualization extension converts the large datasets* captured by today’s high-volume imaging techniques to multi-resolution pyramidal formats for quick, easy visualization.
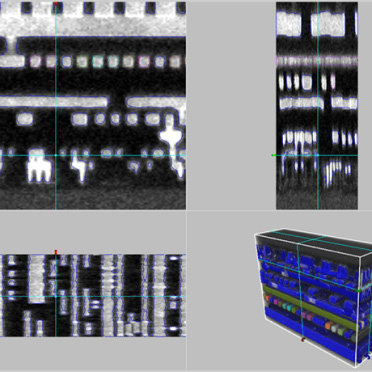
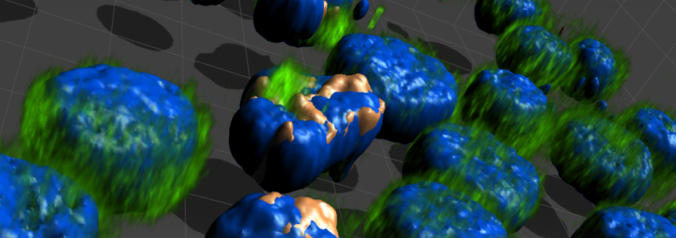
Guided Segmentation is designed to enable the identification and measurement of any 3D Object using a simplified guided process that excels over current 3D segmentation techniques.
Generate Outlines
Use any 2D frame to define objects as unique collections of outlines. Name and color code them for clarity.
Z Propagation
Propagate the segmentation up or down through the stack, using Auto or Semi-Auto techniques and review the outlines for edits as needed.
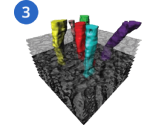
Isosurface Creation
Automatically generate isosurfaces from your collection(s) of outlines. Measure volume, surface, intensity, and unique morphological object measurements.
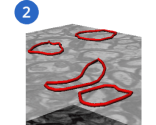
Measure isolated 3D objects using straightforward point-to-point tools when individual object geometry is needed.
Distance, Areas, Volumes
Centroids, Angles, Contours
Retain Quantitative Accuracy
Change Backgrounds
Change your background and apply gradient bleeding to create the highest possible contract between your data and the background.
Adjust Lighting
Control your volume's light in two different directions with intensity, color, and angle adjustments.
Apply Shadows
Shadow Projections can produce shadows on 3 walls of the volume frame and accentuate the morphology and interaction of objects.
Remove Regions
View the interactions of various materials by clipping away distracting or unnecessary regions using a Volume of interest.
Segment by Intensity
Use histogram-based methods to select your areas of interest, instantly highlighting them as 3D objects in the volume display. There is no limit to the number of segmentations you can perform, so even subtle variations in gray-scale or color can be separated for analysis.
Filter by Measurement
With any of the chosen measurements, create a histogram of your segmented regions and only keep what you find relevant, excluding the rest using multiple precise parameters such as a combination of morphology and intensity measurements.
Classify by Measurement
With any of the chosen measurements, create a histogram of your segmented regions and only keep what you find relevant, excluding the rest using multiple precise parameters such as a combination of morphology and intensity measurements.
Eliminate Objects Touching Image Border
In cases where you only want complete and intact volumes that are not cut off by the image stack’s borders, you can enable the clean borders setting to ignore these objects.
Object Splitting & Merging
It becomes necessary to split touching objects in many images, so we’ve provided both automatic watershed-based splitting techniques and a manual point-to-point-based splitting method to get the job done.
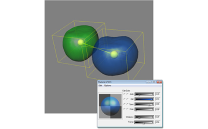
Object Appearance
The appearance of each object is very important to accurate visualization so parameters for each object are able to be edited including color, transparency, and specularity.
Object Naming and Coloring
This makes it easier to keep track of “what’s what” by allowing you to give each object a unique name and color by editing the data table or simply double-clicking the object itself.
Set Data Collection
With the press of a button all the data from your table is compiled into Data Collector. You can even set it up to collect from all images automatically as they are measured.
Link Collected Data
For a multi-image experiment, collect large clusters of data from each image separately and retain the original links to understand how image groups compare and contrast.
Graph the Results
Use a variety of graph types for your data such as 2D and 3D scatterplots, histograms, block charts, and line graphs.
Choose from 60+ measurements to display in tables and graphs
Sort and Condense
Sort by measurements and adjust tables to only show the relevant data.
Group Results and View Statistics
Combine classes of similar objects into a custom hierarchy and see statistics per measurement for each grouped class.
 AutoQuant Deconvolution
Clearer 2D and 3D images in a fraction of the time
The best of AutoQuant standalone software has been upgraded, lab tested, GPU-accelerated by default, simplified into a single intuitive dialog, and is ready to fit into your imaging workflow.
The AutoQuant Deconvolution Module delivers repeatable, quality results in only a fraction of the time. Restore image fidelity, enhance quality, and reverse distortions introduced during the image acquisition process.
 License Server
Dynamic Availability
Access licenses anywhere Image-Pro is installed on an internal network.
Greater Module Access
Key modules are available to everyone and not fixed to a specific workstation.
Auto License Return
Maximize license availability by establishing time-out limits for inactivity.

Virtual Private Network (VPN)
Virtual Machines

Stay up-to-date
Protect against hacking
Maintain integrity
Ensure your system is capable of running the Image-Pro License Server
* The FlexNet Embedded license server has only been validated on
CentOS 7 and 8, but can also be run on RedHat Enterprise Linux 7 or 8
.
** .NET Framework 4.5 or later is required for Windows platforms.
For machine where the FlexNet Embedded local license server is installed:
12 Marina Boulevard
#17-01 Marina Bay Financial Centre
Singapore 018982
Contact: +65 6245 4965
©2023 by Asia Imaging Pte. Ltd.